2,033
Views
46
CrossRef citations to date
0
Altmetric
Report

Squamousness: Next-generation sequencing reveals shared molecular features across squamous tumor types

, , , &
Pages 2355-2361 | Received 03 Apr 2015, Accepted 16 May 2015, Published online: 01 Jul 2015

Figures & data

Figure 1. Frequency and type of molecular alterations identified in 361 patients with diverse squamous cell carcinomas. (A) Bar graph representing the alteration frequency. Only the more frequent alterations are represented (at least 10 patients with the alteration), and some patients had multiple alterations in the same gene. (B) Pie chart displaying the different type of alterations. Other refers to truncation (n = 11 ), fusion (n = 3 ), rearrangement (n = 3 ), deletion (n = 2 ), and duplication (n = 1 ). (C) Bar graph representing the number of patients by number of molecular alterations. Patients had a median of 4 alterations, (range 1–11).
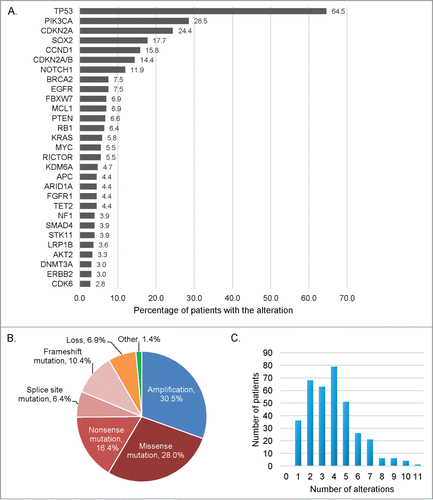
Figure 1. Frequency and type of molecular alterations identified in 361 patients with diverse squamous cell carcinomas. (A) Bar graph representing the alteration frequency. Only the more frequent alterations are represented (at least 10 patients with the alteration), and some patients had multiple alterations in the same gene. (B) Pie chart displaying the different type of alterations. Other refers to truncation (n = 11 ), fusion (n = 3 ), rearrangement (n = 3 ), deletion (n = 2 ), and duplication (n = 1 ). (C) Bar graph representing the number of patients by number of molecular alterations. Patients had a median of 4 alterations, (range 1–11).

Table 1. Histologies breakdown of 361 squamous cell carcinomas

Figure 2. Significant differences in frequency of molecular alterations between squamous vs. non-squamous cases. Only genes that were found to be aberrant at statistically different rates () in squamous versus non-squamous cancers were included. (A) Bar graph comparing the alteration frequencies between squamous vs. non-squamous cases. (B) Raw data on each patient in a “reverse array” fashion. Each pink bar corresponds to an alteration in the designated gene in one patient. Squamous cases have an over-representation of alterations in all the genes included, except KRAS (whose alterations are under-represented in SCCs). All the P-values were ≤0 .001, except for FBXW7 (P = 0 .048). All detailed P-values can be found in .
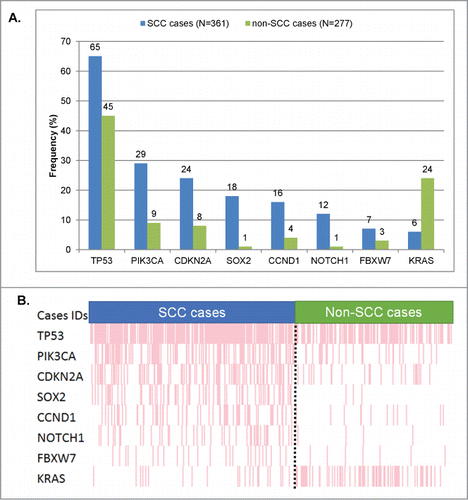
Figure 2. Significant differences in frequency of molecular alterations between squamous vs. non-squamous cases. Only genes that were found to be aberrant at statistically different rates (Table 2) in squamous versus non-squamous cancers were included. (A) Bar graph comparing the alteration frequencies between squamous vs. non-squamous cases. (B) Raw data on each patient in a “reverse array” fashion. Each pink bar corresponds to an alteration in the designated gene in one patient. Squamous cases have an over-representation of alterations in all the genes included, except KRAS (whose alterations are under-represented in SCCs). All the P-values were ≤0 .001, except for FBXW7 (P = 0 .048). All detailed P-values can be found in Table 2.

Table 2. Alteration frequency differences in squamous versus non-squamous cell carcinomas (multivariable analysis)

Figure 3. Squamousness signature frequency: comparison by histology. For this analysis, one point (cumulative) was given for each of the genes where abnormalities were more prevalent in squamous tumors–TP53, PIK3CA, CCND1, CDKN2A, SOX2, NOTCH1, and FBXW7– each time they were present. Because KRAS aberrations were significantly less prevalent in squamous tumors, 1 point was also assigned for the absence of KRAS. The numbers were then added up for each case. Overall, squamous cases had a median of 3 points versus only 1 point for non-squamous cases, P < 0.0001. In this bar graph, we represented the percentages of patients with ≥2 points (2 points was the median for the overall population (squamous and non-squamous cases)). All the P-values comparing squamous (blue bars) vs. non-squamous cases (red bars) were ≤0 .006. When comparing squamous tumors of a particular histology with all other squamous tumors (blue versus green bars), no significant differences were seen. For details on numbers and P-values refer to Table S2.
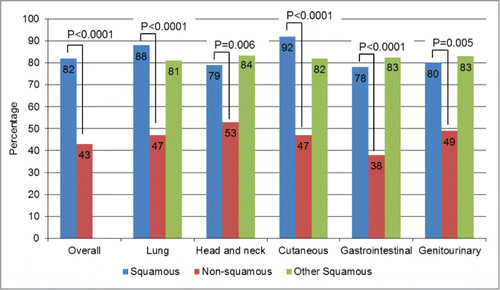
Figure 3. Squamousness signature frequency: comparison by histology. For this analysis, one point (cumulative) was given for each of the genes where abnormalities were more prevalent in squamous tumors–TP53, PIK3CA, CCND1, CDKN2A, SOX2, NOTCH1, and FBXW7– each time they were present. Because KRAS aberrations were significantly less prevalent in squamous tumors, 1 point was also assigned for the absence of KRAS. The numbers were then added up for each case. Overall, squamous cases had a median of 3 points versus only 1 point for non-squamous cases, P < 0.0001. In this bar graph, we represented the percentages of patients with ≥2 points (2 points was the median for the overall population (squamous and non-squamous cases)). All the P-values comparing squamous (blue bars) vs. non-squamous cases (red bars) were ≤0 .006. When comparing squamous tumors of a particular histology with all other squamous tumors (blue versus green bars), no significant differences were seen. For details on numbers and P-values refer to Table S2.

Figure 4. Significant co-alterations in patients with SCCs. Reverse array plot displaying raw data. Each pink bar corresponds to an alteration in the designated gene in one patient (total N = 361 SCC and N = 277 non-SCC specimens). (A) (squamous cases) and (B) (non-squamous cases) have been sorted according to the presence of TP53 mutations. Panel A shows that within squamous tumors, TP53 is co-altered with CDKN2A/CCND1, P < 0.0001 (P-values were also ≤0 .001 if CDKN2A and CCND1 were considered separately). There also was a negative association between TP53 and PIK3CA alteration, P = 0.001. (B) shows that within non-squamous tumors, TP53 alterations were also associated with CDKN2A/CCND1, P = 0 .003 (P-value = 0 .008 for CCND1 and P = 0 .129 for CDKN2A when considered separately). However, the co-alteration frequency of TP53 and CDKN2A/CCND1 was significantly higher in squamous tumors (31% vs. 9%, P < 0.0001). No association (positive or negative) was found between TP53 and PIK3CA in non-squamous cases. (C) (squamous cases) and (D) (non-squamous cases) display the same data as panel A and B, but sorted by the presence of PIK3CA alteration. Within squamous tumors, PIK3CA is co-altered with SOX2 (P < 0.0001). (D) PIK3CA alterations are not significantly associated with SOX2 in non-squamous tumors.
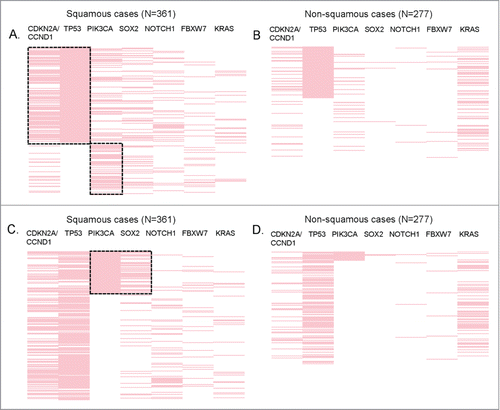
Figure 4. Significant co-alterations in patients with SCCs. Reverse array plot displaying raw data. Each pink bar corresponds to an alteration in the designated gene in one patient (total N = 361 SCC and N = 277 non-SCC specimens). (A) (squamous cases) and (B) (non-squamous cases) have been sorted according to the presence of TP53 mutations. Panel A shows that within squamous tumors, TP53 is co-altered with CDKN2A/CCND1, P < 0.0001 (P-values were also ≤0 .001 if CDKN2A and CCND1 were considered separately). There also was a negative association between TP53 and PIK3CA alteration, P = 0.001. (B) shows that within non-squamous tumors, TP53 alterations were also associated with CDKN2A/CCND1, P = 0 .003 (P-value = 0 .008 for CCND1 and P = 0 .129 for CDKN2A when considered separately). However, the co-alteration frequency of TP53 and CDKN2A/CCND1 was significantly higher in squamous tumors (31% vs. 9%, P < 0.0001). No association (positive or negative) was found between TP53 and PIK3CA in non-squamous cases. (C) (squamous cases) and (D) (non-squamous cases) display the same data as panel A and B, but sorted by the presence of PIK3CA alteration. Within squamous tumors, PIK3CA is co-altered with SOX2 (P < 0.0001). (D) PIK3CA alterations are not significantly associated with SOX2 in non-squamous tumors.
Supplemental material

1053669_supplemental_files.docx

Download MS Word (17.8 KB)