1,943
Views
15
CrossRef citations to date
0
Altmetric
Report

Mutant lamin A links prophase to a p53 independent senescence program

, , , , &
Pages 2408-2421 | Received 08 Apr 2015, Accepted 16 May 2015, Published online: 30 Jun 2015

Figures & data

Figure 1. Accumulation of lamin (A) in the nuclear envelope inhibits cancer cell growth. (A) Immunoblot for lamin A/C of U-2 OS cells expressing vector (V), wild type lamin A (wt), progerin (Pr) or L647R lamin A (LR). (B) Growth curves of U-2 OS cells expressing vector, progerin, L647R lamin A or wild type lamin A (wtLaminA). Cells were plated in triplicate 4 d after infection with a retroviral vector expressing wtLamin A, progerin, or L647R lamin A mutant. Relative cell numbers were estimated from a crystal violet staining assay. (C) qPCR showing ZMPSTE24 mRNA levels of U-2 OS cells with a control shRNA (NTC) or shZMPSTE24. (D) Growth curves of U-2 OS cells expressing shZMPSTE24 or NTC. (E) Immunoblots for the indicated proteins of U-2 OS cells and (F) H 1299 with a control shRNA (NTC) or shZMPSTE24. (G) Growth curves of H 1299 cells expressing wild type lamin A and NTC (wtLaminA/NTC), shZMPSTE24 and vector (shZMPSTE24/V), or wild type lamin A and shZMPSTE24 (wtLaminA/shZMPSTE24). (H) Immunofluorescence images of H 1299 cells expressing the vectors indicated in (G). Magnification = 10 μm.
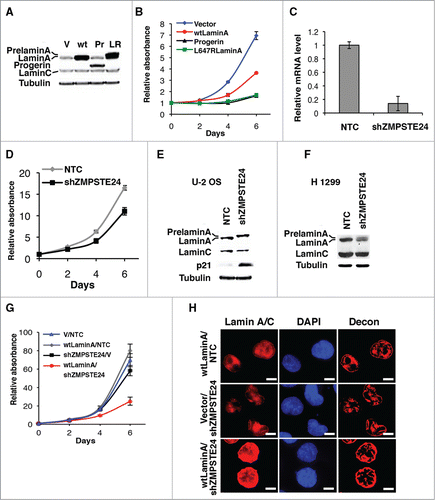
Figure 1. Accumulation of lamin (A) in the nuclear envelope inhibits cancer cell growth. (A) Immunoblot for lamin A/C of U-2 OS cells expressing vector (V), wild type lamin A (wt), progerin (Pr) or L647R lamin A (LR). (B) Growth curves of U-2 OS cells expressing vector, progerin, L647R lamin A or wild type lamin A (wtLaminA). Cells were plated in triplicate 4 d after infection with a retroviral vector expressing wtLamin A, progerin, or L647R lamin A mutant. Relative cell numbers were estimated from a crystal violet staining assay. (C) qPCR showing ZMPSTE24 mRNA levels of U-2 OS cells with a control shRNA (NTC) or shZMPSTE24. (D) Growth curves of U-2 OS cells expressing shZMPSTE24 or NTC. (E) Immunoblots for the indicated proteins of U-2 OS cells and (F) H 1299 with a control shRNA (NTC) or shZMPSTE24. (G) Growth curves of H 1299 cells expressing wild type lamin A and NTC (wtLaminA/NTC), shZMPSTE24 and vector (shZMPSTE24/V), or wild type lamin A and shZMPSTE24 (wtLaminA/shZMPSTE24). (H) Immunofluorescence images of H 1299 cells expressing the vectors indicated in (G). Magnification = 10 μm.

Figure 2. S22A-progerin triggers a cell proliferation arrest and a multinucleated phenotype in tumor cells. (A-C) Growth curves of different cancer cell lines expressing the indicated vectors. (D) Colony formation assay of cell lines as in (A-C). (E) Quantitation of cell growth in the colony formation assay using crystal violet staining. (F) Immunofluorescence for lamin A/C of U-2 OS cells expressing a vector control, progerin (Pr) or S22A-progerin (S22A). Decon means deconvolution option of Metamorph software. (G) Immunofluorescence showing the cell nucleus (blue-DAPI staining) and the cytoskeleton (red-Tubulin) in the indicated cell lines expressing vector, progerin or S22A-progerin. The percent and S.D of multinuclear cells are indicated at the bottom right of each panel. Magnification = 10 μm.
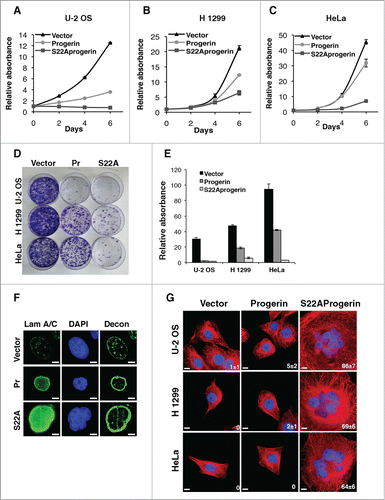
Figure 2. S22A-progerin triggers a cell proliferation arrest and a multinucleated phenotype in tumor cells. (A-C) Growth curves of different cancer cell lines expressing the indicated vectors. (D) Colony formation assay of cell lines as in (A-C). (E) Quantitation of cell growth in the colony formation assay using crystal violet staining. (F) Immunofluorescence for lamin A/C of U-2 OS cells expressing a vector control, progerin (Pr) or S22A-progerin (S22A). Decon means deconvolution option of Metamorph software. (G) Immunofluorescence showing the cell nucleus (blue-DAPI staining) and the cytoskeleton (red-Tubulin) in the indicated cell lines expressing vector, progerin or S22A-progerin. The percent and S.D of multinuclear cells are indicated at the bottom right of each panel. Magnification = 10 μm.

Figure 3. DNA content analysis reveals the polyploidy of the S22A-progerin-expressing cells. (A) DNA content analysis was performed by fluorescence activated cell sorting (FACS) of U-2 OS cells expressing vector, progerin, or S22A-progerin. Quantification of the DNA content analysis (%) is shown in each panel. (B) Immunoblots for the indicated proteins of U-2 OS cells expressing the vectors as in (A). (C) FACS of U-2 OS cells expressing vector and a control shRNA (NTC), vector (V) and shZMPSTE24, S22A-wild type lamin A (S22ALam) and NTC, S22ALam and shZMPSTE24, or S22A-progerin and NTC. Quantification of DNA content analysis (%) of FACS is shown in each panel. (D) Quantification of cells with 2 or more nuclei in U-2 OS or HeLa cells after infections with a retroviral vector expressing S22A-progerin or an empty vector control.
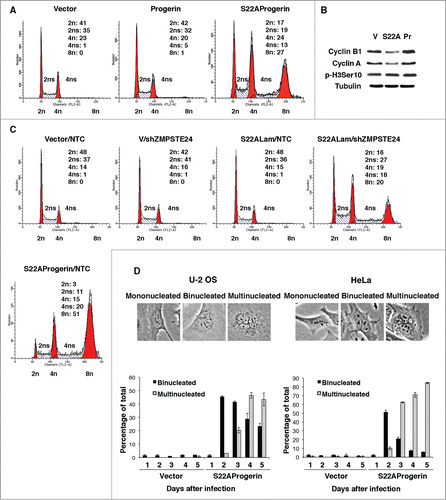
Figure 3. DNA content analysis reveals the polyploidy of the S22A-progerin-expressing cells. (A) DNA content analysis was performed by fluorescence activated cell sorting (FACS) of U-2 OS cells expressing vector, progerin, or S22A-progerin. Quantification of the DNA content analysis (%) is shown in each panel. (B) Immunoblots for the indicated proteins of U-2 OS cells expressing the vectors as in (A). (C) FACS of U-2 OS cells expressing vector and a control shRNA (NTC), vector (V) and shZMPSTE24, S22A-wild type lamin A (S22ALam) and NTC, S22ALam and shZMPSTE24, or S22A-progerin and NTC. Quantification of DNA content analysis (%) of FACS is shown in each panel. (D) Quantification of cells with 2 or more nuclei in U-2 OS or HeLa cells after infections with a retroviral vector expressing S22A-progerin or an empty vector control.

Figure 4. S22A-progerin expressing cells display invaginations of the nuclear envelope, nuclear fragmentation and a failure in chromosome condensation. (A) Immunofluorescence with a progerin specific antibody in U-2 OS cells expressing vector, progerin, or S22A-progerin. Magnification = 10 μm. (B) Electron microscopy showing a cell where a nuclear envelope invagination divides the nuclei in 2 fragments. The black arrows indicate the outer nuclear membrane (ONM) and the white arrows the inner nuclear membrane (INM). (C) Dapi staining of U-2 OS cells expressing vector, progerin, or S22A-progerin. The percent of cells with condensed chromosomes is indicated at the bottom right of each panel. Magnification = 10 μm.
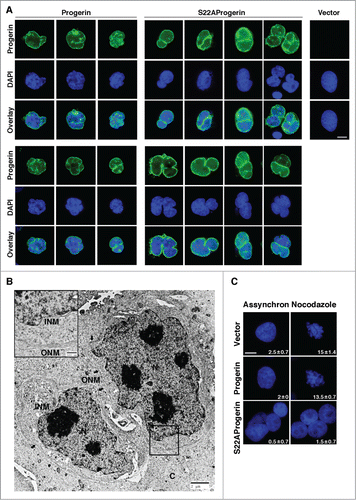
Figure 4. S22A-progerin expressing cells display invaginations of the nuclear envelope, nuclear fragmentation and a failure in chromosome condensation. (A) Immunofluorescence with a progerin specific antibody in U-2 OS cells expressing vector, progerin, or S22A-progerin. Magnification = 10 μm. (B) Electron microscopy showing a cell where a nuclear envelope invagination divides the nuclei in 2 fragments. The black arrows indicate the outer nuclear membrane (ONM) and the white arrows the inner nuclear membrane (INM). (C) Dapi staining of U-2 OS cells expressing vector, progerin, or S22A-progerin. The percent of cells with condensed chromosomes is indicated at the bottom right of each panel. Magnification = 10 μm.

Figure 5. Role of p53 in S22A-progerin expressing cells. (A) DNA content analysis of U-2 OS cells expressing vector or S22A-progerin with shRNA control (NTC) or shRNA against p53. Quantification of the DNA content analysis (%) is shown in each panel. (B) Quantification of cells with 2 or more nuclei in U-2 OS as in (A). (C) Immunoblots for the indicated proteins using extracts from cells as in (A). (D) Colony formation assay of cell lines as in (A). (E) Quantitation of cell growth in the colony formation assay using crystal violet staining. (F) Cell viability in the indicated cell lines using a trypan blue exclusion assay. (G) Quantitation of cells with 2 or more nuclei in U-2 OS expressing the indicated vectors and treated with 40 μM resveratrol or vehicle for 48 hours.
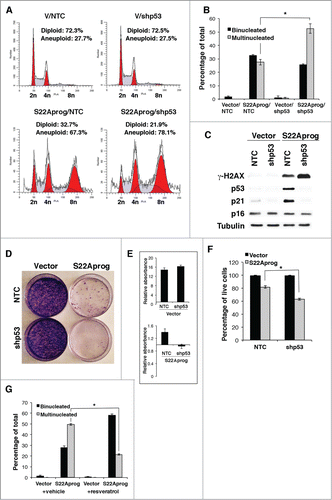
Figure 5. Role of p53 in S22A-progerin expressing cells. (A) DNA content analysis of U-2 OS cells expressing vector or S22A-progerin with shRNA control (NTC) or shRNA against p53. Quantification of the DNA content analysis (%) is shown in each panel. (B) Quantification of cells with 2 or more nuclei in U-2 OS as in (A). (C) Immunoblots for the indicated proteins using extracts from cells as in (A). (D) Colony formation assay of cell lines as in (A). (E) Quantitation of cell growth in the colony formation assay using crystal violet staining. (F) Cell viability in the indicated cell lines using a trypan blue exclusion assay. (G) Quantitation of cells with 2 or more nuclei in U-2 OS expressing the indicated vectors and treated with 40 μM resveratrol or vehicle for 48 hours.

Figure 6. S22A-progerin induces tumor cell senescence. (A) Senescence associated β-galactosidase staining in the indicated cell lines expressing wild type lamin A (wtlamin A), progerin or S22A-progerin. (B) Immunofluorescence for γ-H2AX in the indicated cell lines. (C-D) Immunofluorescence for PML bodies (C) or γ-H2AX (D) of U-2 OS cells expressing wild type lamin A (wt), progerin (prog) or S22A-progerin (S22Aprog). The percent and S.D labeled cells are indicated at the bottom right of each panel. Magnification = 10 μm. (E) Immunoflourescence of cells co-stained for lamin A and γ-H2AX (F-H) qPCR for genes whose expression change with senescence in U-2 OS cells. (I) Immunoblots for the indicated proteins of U-2 OS cells with empty vector (V), S22A-progerin (S22A) or progerin (Pr). All markers in A-I were measured at day 5 post-infection.
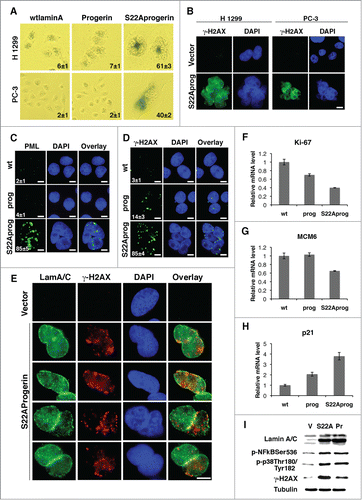
Figure 6. S22A-progerin induces tumor cell senescence. (A) Senescence associated β-galactosidase staining in the indicated cell lines expressing wild type lamin A (wtlamin A), progerin or S22A-progerin. (B) Immunofluorescence for γ-H2AX in the indicated cell lines. (C-D) Immunofluorescence for PML bodies (C) or γ-H2AX (D) of U-2 OS cells expressing wild type lamin A (wt), progerin (prog) or S22A-progerin (S22Aprog). The percent and S.D labeled cells are indicated at the bottom right of each panel. Magnification = 10 μm. (E) Immunoflourescence of cells co-stained for lamin A and γ-H2AX (F-H) qPCR for genes whose expression change with senescence in U-2 OS cells. (I) Immunoblots for the indicated proteins of U-2 OS cells with empty vector (V), S22A-progerin (S22A) or progerin (Pr). All markers in A-I were measured at day 5 post-infection.

Table 1. The secretome of S22 A-progerin induced senescence in U-2 OS cells

Figure 7. S22A-progerin blocks tumor progression in mice. (A) Tumor formation in BALB/c nude mice injected with 106 H 1299 cells expressing vector or S22A-progerin (S22Aprog). (B) Relative tumor growth in BALB/c nude mice injected with H 1299 cells expressing a vector or S22A-progerin. * = p value <0.05. Error bars indicate SEM. (C) Summary of number of tumors developed in BALB/c nude mice. (D) Immunofluorescence for lamin A in tumor sections from mice inoculated with H 1299 cells expressing vector or S22A-progerin. Right panel shows the same staining in H 1299 cells before inoculation in mice. Magnification = 10 μm. (E) qPCR for LMNA (isoform A-delta50) in H 1299 cells expressing vector (V) of S22A-progerin (S22A) or from tumors as in (A). (F) Immunoblots for lamin A/C in tumors and H 1299 cells as in (A). Numbers indicate different tumors.
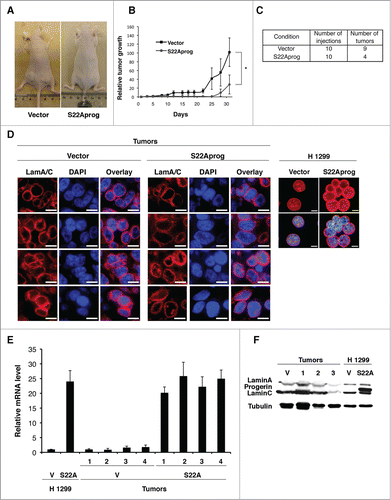
Figure 7. S22A-progerin blocks tumor progression in mice. (A) Tumor formation in BALB/c nude mice injected with 106 H 1299 cells expressing vector or S22A-progerin (S22Aprog). (B) Relative tumor growth in BALB/c nude mice injected with H 1299 cells expressing a vector or S22A-progerin. * = p value <0.05. Error bars indicate SEM. (C) Summary of number of tumors developed in BALB/c nude mice. (D) Immunofluorescence for lamin A in tumor sections from mice inoculated with H 1299 cells expressing vector or S22A-progerin. Right panel shows the same staining in H 1299 cells before inoculation in mice. Magnification = 10 μm. (E) qPCR for LMNA (isoform A-delta50) in H 1299 cells expressing vector (V) of S22A-progerin (S22A) or from tumors as in (A). (F) Immunoblots for lamin A/C in tumors and H 1299 cells as in (A). Numbers indicate different tumors.
Supplemental material

1053671_supplemental_files.docx

Download MS Word (34 MB)

Reprints and Corporate Permissions

Please note: Selecting permissions does not provide access to the full text of the article, please see our help page How do I view content?

To request a reprint or corporate permissions for this article, please click on the relevant link below:

Academic Permissions

Please note: Selecting permissions does not provide access to the full text of the article, please see our help page How do I view content?

Obtain permissions instantly via Rightslink by clicking on the button below:

If you are unable to obtain permissions via Rightslink, please complete and submit this Permissions form. For more information, please visit our Permissions help page.