2,145
Views
29
CrossRef citations to date
0
Altmetric
Report

High levels of RAD51 perturb DNA replication elongation and cause unscheduled origin firing due to impaired CHK1 activation

, , , , , , , , , , , & show all
Pages 3190-3202 | Received 14 Jan 2015, Accepted 16 May 2015, Published online: 23 Oct 2015

Figures & data

Figure 1. High levels of RAD51 increase genomic instability. Protein expression patterns in (A) U2OS cells transfected with a hormone-inducible RAD51 expression vector and (B) breast cancer cell lines. Induction of high RAD51 in U2OS cells was performed by addition of 1 µM Pon A for 24 h. (top) Protein was assessed by RAD51 immunoblotting with β-actin as loading control. (bottom) Quantification of RAD51 expression relative to levels of β-actin. Mean values of at least 3 independent protein extracts are shown. (C) RAD51 foci (left) and γH2AX-foci (right) in untreated U2OS cells with RAD51 overexpression. Exponentially growing cells were fixed 24 h after induction of RAD51 overexpression, immuno-stained for RAD51 or γH2AX, counterstained with DAPI and foci formation was quantified. Columns depict the mean number of RAD51 foci per cell and bars represent the standard error of the mean of at least 3 experiments. Statistical analysis was performed using Student's t-test. (D) Chromatid-type (left) and chromosome-type (right) aberrations in untreated U2OS cells with RAD51 overexpression. Representative examples for both types of chromosome aberrations are shown in the middle. Exponentially growing cells 24 h after induction of RAD51 overexpression were treated with 0.2 µM colcemid for 4 h and collected at metaphase. Giemsa stained chromatid-type or chromosome-type aberrations were scored and expressed as G2- or G1-aberrations per cell. Columns depict data of at least 3 experiments and statistical analysis was performed using Student's t-test.
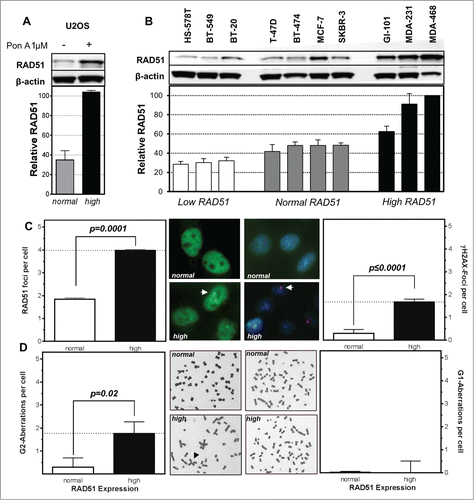
Figure 1. High levels of RAD51 increase genomic instability. Protein expression patterns in (A) U2OS cells transfected with a hormone-inducible RAD51 expression vector and (B) breast cancer cell lines. Induction of high RAD51 in U2OS cells was performed by addition of 1 µM Pon A for 24 h. (top) Protein was assessed by RAD51 immunoblotting with β-actin as loading control. (bottom) Quantification of RAD51 expression relative to levels of β-actin. Mean values of at least 3 independent protein extracts are shown. (C) RAD51 foci (left) and γH2AX-foci (right) in untreated U2OS cells with RAD51 overexpression. Exponentially growing cells were fixed 24 h after induction of RAD51 overexpression, immuno-stained for RAD51 or γH2AX, counterstained with DAPI and foci formation was quantified. Columns depict the mean number of RAD51 foci per cell and bars represent the standard error of the mean of at least 3 experiments. Statistical analysis was performed using Student's t-test. (D) Chromatid-type (left) and chromosome-type (right) aberrations in untreated U2OS cells with RAD51 overexpression. Representative examples for both types of chromosome aberrations are shown in the middle. Exponentially growing cells 24 h after induction of RAD51 overexpression were treated with 0.2 µM colcemid for 4 h and collected at metaphase. Giemsa stained chromatid-type or chromosome-type aberrations were scored and expressed as G2- or G1-aberrations per cell. Columns depict data of at least 3 experiments and statistical analysis was performed using Student's t-test.

Figure 2. High levels of RAD51 decrease HR-frequency and sensitize cells to MMC. (A) Representative examples for I-SceI-induced recombination frequencies in U2OS cells. Cells were transfected with the I-Sce-I linearized pGC substrate (bottom) and monitored as the number of GFP positive cells by FACS analysis. Transfection without linearized plasmids served as control (top). (B) Relative HR-frequency in U2OS cells with normal and high RAD51 expression after stable (left) or transient (right) transfection of the GFP-reporter. For both experiments a high level of RAD51 was induced for 24 h before transfection and HR-frequencies were calculated 24 h later. Columns depict the percentage of recombination events and bars represent the standard deviation of at least 3 experiments. Statistical analyses were performed using Student's t-test. (C) Relative HR-frequency in breast cancer cell lines with low, normal and high RAD51 expression. Cells were transiently transfected and HR-frequencies were calculated 24 h after transfection. Symbols depict the percentage of recombination events and bars represent the standard deviation of at least 3 experiments. Statistical analyses were performed using Student's t-test. (D) Influence of RAD51 protein expression in different breast cancer cell lines on HR frequency. Data were taken from and fitted by linear regression analysis. (E) Cellular sensitivity to MMC in U2OS and (F) breast cancer cell lines. Exponentially growing cells were treated with increasing doses up to 60 nM MMC for 24h (U2OS) or with 1.5 µM (breast cancer cell lines) for 1 h and cellular sensitivity was monitored by colony formation. Data of at least 3 independent experiments were fitted by linear regression analysis (A) or statistical analysis was performed using Student's t-test (B).
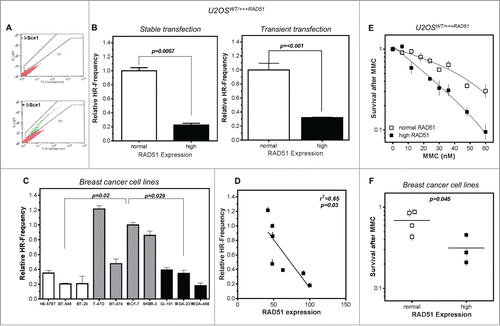
Figure 2. High levels of RAD51 decrease HR-frequency and sensitize cells to MMC. (A) Representative examples for I-SceI-induced recombination frequencies in U2OS cells. Cells were transfected with the I-Sce-I linearized pGC substrate (bottom) and monitored as the number of GFP positive cells by FACS analysis. Transfection without linearized plasmids served as control (top). (B) Relative HR-frequency in U2OS cells with normal and high RAD51 expression after stable (left) or transient (right) transfection of the GFP-reporter. For both experiments a high level of RAD51 was induced for 24 h before transfection and HR-frequencies were calculated 24 h later. Columns depict the percentage of recombination events and bars represent the standard deviation of at least 3 experiments. Statistical analyses were performed using Student's t-test. (C) Relative HR-frequency in breast cancer cell lines with low, normal and high RAD51 expression. Cells were transiently transfected and HR-frequencies were calculated 24 h after transfection. Symbols depict the percentage of recombination events and bars represent the standard deviation of at least 3 experiments. Statistical analyses were performed using Student's t-test. (D) Influence of RAD51 protein expression in different breast cancer cell lines on HR frequency. Data were taken from Figures 1B and 2C and fitted by linear regression analysis. (E) Cellular sensitivity to MMC in U2OS and (F) breast cancer cell lines. Exponentially growing cells were treated with increasing doses up to 60 nM MMC for 24h (U2OS) or with 1.5 µM (breast cancer cell lines) for 1 h and cellular sensitivity was monitored by colony formation. Data of at least 3 independent experiments were fitted by linear regression analysis (A) or statistical analysis was performed using Student's t-test (B).

Figure 3. Perturbance of DNA replication processes in U2OS cells with high levels of RAD51. (A) Schematic of single DNA fiber analysis. Red tracts CldU; green tracts IdU. (B) Examples of various types of tracts like symmetric and asymmetric replication tracts in cells with normal (top) or high (bottom) RAD51 expression. (C) Replication fork speed in untreated U2OS cells with normal and high RAD51 expression. Cells were sequentially pulse-labeled with CldU followed by IdU and replication fork speed (kb/min) was detected by immunofluorescence with specific antibodies. Statistical analysis was performed using Student's t-test. (D) Percentage of asymmetrical replication tracts in cells with normal and high RAD51 expression. IdU/CldU length ratios from at least 1,400 replication tracts of at least 3 independent experiments were calculated by dividing IdU/CldU tracts and statistical analysis was performed using Student's t-test (right). (E) Influence of RAD51 protein expression in different U2OS strains on replication fork speed. Induction of high RAD51 expression was performed by addition of 1 µM Pon A for 24 hrs. After removal RAD51 expression was assessed over 120 days post Pon A treatment by Western analysis in total cell lysates from exponentially growing cells; β-actin was used as a loading control (top). Lane 11 represents RAD51 expression 24 hrs after induction. In parallel, replication fork speed was detected by immunofluorescence with specific antibodies at the same time points and plotted against relative RAD51 expression.. Data were fitted by linear regression analysis. (F) Examples and (G) relative frequency of 1st pulse origin firing in untreated U2OS cells with normal and high RAD51 expression. Cells were sequentially pulse-labeled with CldU followed by IdU, origins detected by immunofluorescence with specific antibodies and the percentage of 1st origins relative to all replication structures was calculated. Statistical analysis of at least 3 different experiments was performed using Student's t-test. (H) Quantification of ori-to-ori distances in U2OS cells with normal and high RAD51 expression. Length between adjacent origins was measured and expressed as ori-to-ori distances in kb. Data were collected from 3 different experiments and statistical analysis was performed using Student's t-test.
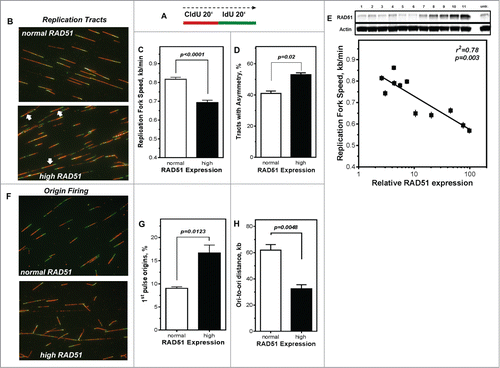
Figure 3. Perturbance of DNA replication processes in U2OS cells with high levels of RAD51. (A) Schematic of single DNA fiber analysis. Red tracts CldU; green tracts IdU. (B) Examples of various types of tracts like symmetric and asymmetric replication tracts in cells with normal (top) or high (bottom) RAD51 expression. (C) Replication fork speed in untreated U2OS cells with normal and high RAD51 expression. Cells were sequentially pulse-labeled with CldU followed by IdU and replication fork speed (kb/min) was detected by immunofluorescence with specific antibodies. Statistical analysis was performed using Student's t-test. (D) Percentage of asymmetrical replication tracts in cells with normal and high RAD51 expression. IdU/CldU length ratios from at least 1,400 replication tracts of at least 3 independent experiments were calculated by dividing IdU/CldU tracts and statistical analysis was performed using Student's t-test (right). (E) Influence of RAD51 protein expression in different U2OS strains on replication fork speed. Induction of high RAD51 expression was performed by addition of 1 µM Pon A for 24 hrs. After removal RAD51 expression was assessed over 120 days post Pon A treatment by Western analysis in total cell lysates from exponentially growing cells; β-actin was used as a loading control (top). Lane 11 represents RAD51 expression 24 hrs after induction. In parallel, replication fork speed was detected by immunofluorescence with specific antibodies at the same time points and plotted against relative RAD51 expression.. Data were fitted by linear regression analysis. (F) Examples and (G) relative frequency of 1st pulse origin firing in untreated U2OS cells with normal and high RAD51 expression. Cells were sequentially pulse-labeled with CldU followed by IdU, origins detected by immunofluorescence with specific antibodies and the percentage of 1st origins relative to all replication structures was calculated. Statistical analysis of at least 3 different experiments was performed using Student's t-test. (H) Quantification of ori-to-ori distances in U2OS cells with normal and high RAD51 expression. Length between adjacent origins was measured and expressed as ori-to-ori distances in kb. Data were collected from 3 different experiments and statistical analysis was performed using Student's t-test.

Figure 4. Activation of CHK1 is diminished in cells with high levels of RAD51, resulting in reduced fork speed and increased dormant origin activation after DNA damage. (A) Activation of CHK1 after DNA damage. Exponentially growing U2OS cells with normal or high RAD51 expression were exposed to 1.5 µM MMC or 200 µM hydrogen peroxide for 1 h, total protein was extracted at the indicated time points, CHK1 and pCHK1 (Ser345) proteins were visualized by immunoblotting. pCHK1 was densitometrically quantified relative to levels of total CHK1 protein and β-actin served as a loading control. (B) Activation of CHK1 after DNA damage in breast cancer cell lines. Exponentially growing cells were exposed to 1.5 µM MMC for 1 h, total protein was extracted at time points indicated, CHK1 and pCHK1 (Ser345) (left) or pCHK1 (S296) (right) proteins were detected by immunoblotting. pCHK1 was quantified relative to levels of total CHK1 protein signals and β-actin served as a loading control. Statistical analysis of at least 3 different protein extracts was performed using Student's t-test. (C) Effect of DNA damage on replication fork speed, (D) 2nd pulse origin firing (left) and 2nd pulse origin firing adjacent to stalled replication forks (right). Cells were sequentially pulse-labeled, DNA damage was induced during the IdU label and fiber structures were detected by immunoflourescence. Damage was induced by treatment with 500 µM MMS, 50 µM or 200 µM hydrogen peroxide, 1.5 µM MMC or 1 µM topotecan. Replication fork speed was expressed as kb/min and origin firing was calculated relative to all replication structures analyzed. Error bars represent the standard error of the mean (SEM), *** corresponds to P < 0.001.
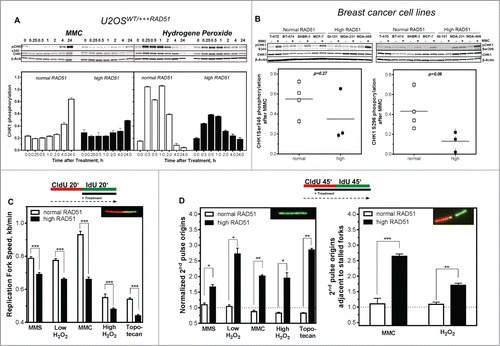
Figure 4. Activation of CHK1 is diminished in cells with high levels of RAD51, resulting in reduced fork speed and increased dormant origin activation after DNA damage. (A) Activation of CHK1 after DNA damage. Exponentially growing U2OS cells with normal or high RAD51 expression were exposed to 1.5 µM MMC or 200 µM hydrogen peroxide for 1 h, total protein was extracted at the indicated time points, CHK1 and pCHK1 (Ser345) proteins were visualized by immunoblotting. pCHK1 was densitometrically quantified relative to levels of total CHK1 protein and β-actin served as a loading control. (B) Activation of CHK1 after DNA damage in breast cancer cell lines. Exponentially growing cells were exposed to 1.5 µM MMC for 1 h, total protein was extracted at time points indicated, CHK1 and pCHK1 (Ser345) (left) or pCHK1 (S296) (right) proteins were detected by immunoblotting. pCHK1 was quantified relative to levels of total CHK1 protein signals and β-actin served as a loading control. Statistical analysis of at least 3 different protein extracts was performed using Student's t-test. (C) Effect of DNA damage on replication fork speed, (D) 2nd pulse origin firing (left) and 2nd pulse origin firing adjacent to stalled replication forks (right). Cells were sequentially pulse-labeled, DNA damage was induced during the IdU label and fiber structures were detected by immunoflourescence. Damage was induced by treatment with 500 µM MMS, 50 µM or 200 µM hydrogen peroxide, 1.5 µM MMC or 1 µM topotecan. Replication fork speed was expressed as kb/min and origin firing was calculated relative to all replication structures analyzed. Error bars represent the standard error of the mean (SEM), *** corresponds to P < 0.001.

Figure 5. Inhibition of CHK1 does not alter cellular sensitivity in cells with high RAD51 levels. (A) Sensitivity to hydrogen peroxide in U2OS cells with high RAD51 levels. Exponential growing cells were treated for 1 h with increasing hydrogen peroxide concentrations in the presence or absence of a 2 h pre-incubation with 100 nM UCN-O1 24 h after induction of high RAD51 expression and sensitivity was analyzed using the colony formation assay. Mean ± SEM of 3 independent experiments is shown. (B) Sensitivity to hydrogen peroxide after inhibition of CHK1 in breast cancer cell lines. Exponential growing cells were treated with 50 µM hydrogen peroxide in the presence or absence of a 2 h pre-incubation with100 nM UCN-O1 and sensitivity was monitored by colony formation. Mean ± SEM of at least 3 independent experiments is shown and statistical analysis was performed using Student's t-test.
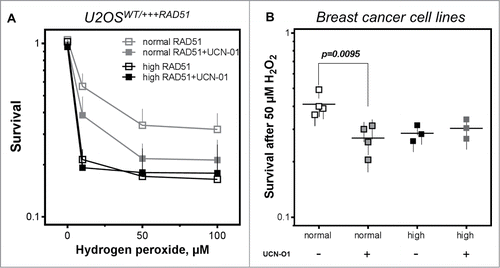
Figure 5. Inhibition of CHK1 does not alter cellular sensitivity in cells with high RAD51 levels. (A) Sensitivity to hydrogen peroxide in U2OS cells with high RAD51 levels. Exponential growing cells were treated for 1 h with increasing hydrogen peroxide concentrations in the presence or absence of a 2 h pre-incubation with 100 nM UCN-O1 24 h after induction of high RAD51 expression and sensitivity was analyzed using the colony formation assay. Mean ± SEM of 3 independent experiments is shown. (B) Sensitivity to hydrogen peroxide after inhibition of CHK1 in breast cancer cell lines. Exponential growing cells were treated with 50 µM hydrogen peroxide in the presence or absence of a 2 h pre-incubation with100 nM UCN-O1 and sensitivity was monitored by colony formation. Mean ± SEM of at least 3 independent experiments is shown and statistical analysis was performed using Student's t-test.

Figure 6. Lower number of RPA foci in cells with high levels of RAD51. Model of increased genomic instability driven by high levels of RAD51. (A) RPA foci formation after treatment with hydrogen peroxide (left) or MMC (right) in U2OS cells with high RAD51 levels. Exponential growing cells were treated for 1 h with 200 µM hydrogen peroxide or 1.5 µM MMC and foci formation was monitored 2 h and 6 h after treatment. Columns depict the mean number of RPA foci per cell and error bars represent the standard error of the mean of at least 3 experiments. Statistical analysis was performed using Student's t-test. (B) Model. A replication fork can stall for various reasons, including one-ended and 2- ended DSBs, resulting in single stranded DNA stretches, which are quickly protected by RPA. This leads to the activation of the ATR-mediated signal cascade and the recruitment of DNA repair proteins. Importantly, in the presence of an oversupply of RAD51 protein, RAD51 may be recruited prematurely. Therefore, the S-phase checkpoint signal cascade is disturbed; stalled forks are not reactivated appropriately, resulting in excessive dormant origin loading followed by higher genomic instability.
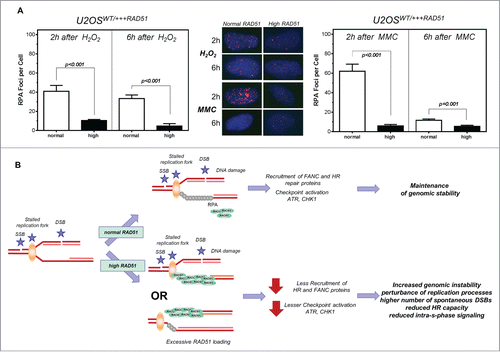
Figure 6. Lower number of RPA foci in cells with high levels of RAD51. Model of increased genomic instability driven by high levels of RAD51. (A) RPA foci formation after treatment with hydrogen peroxide (left) or MMC (right) in U2OS cells with high RAD51 levels. Exponential growing cells were treated for 1 h with 200 µM hydrogen peroxide or 1.5 µM MMC and foci formation was monitored 2 h and 6 h after treatment. Columns depict the mean number of RPA foci per cell and error bars represent the standard error of the mean of at least 3 experiments. Statistical analysis was performed using Student's t-test. (B) Model. A replication fork can stall for various reasons, including one-ended and 2- ended DSBs, resulting in single stranded DNA stretches, which are quickly protected by RPA. This leads to the activation of the ATR-mediated signal cascade and the recruitment of DNA repair proteins. Importantly, in the presence of an oversupply of RAD51 protein, RAD51 may be recruited prematurely. Therefore, the S-phase checkpoint signal cascade is disturbed; stalled forks are not reactivated appropriately, resulting in excessive dormant origin loading followed by higher genomic instability.
Supplemental material

1055996_supplemental_files.pptx

Download MS Power Point (2.6 MB)

Reprints and Corporate Permissions

Please note: Selecting permissions does not provide access to the full text of the article, please see our help page How do I view content?

To request a reprint or corporate permissions for this article, please click on the relevant link below:

Academic Permissions

Please note: Selecting permissions does not provide access to the full text of the article, please see our help page How do I view content?

Obtain permissions instantly via Rightslink by clicking on the button below:

If you are unable to obtain permissions via Rightslink, please complete and submit this Permissions form. For more information, please visit our Permissions help page.