Figures & data
Figure 1. The expression pattern of ISL-1 was parallel to that of CyclinD1 during the cell cycle. (A, B) Flow cytometry assays were performed to analyze the cell cycle distribution of HIT-T15 cells at appropriate time-points after serum starvation for 48 h. (C) HIT-T15 cells were harvested at the indicated time-points after serum starvation for 48 h and subjected to Western blotting analysis. (D) Soluble chromatin was prepared from HIT-T15 cells and then followed by immunoprecipitation with the antibody against ISL-1. The DNA extractions were amplified using the primers that cover the ISL-1 binding sites by real-time PCR. Each bar represents 3 independent experiments, mean ± SD. p values were calculated using a Student's t-test. *p < 0.05, **p < 0.01, #p < 0.05, ##p < 0.01 vs. control (0 h).
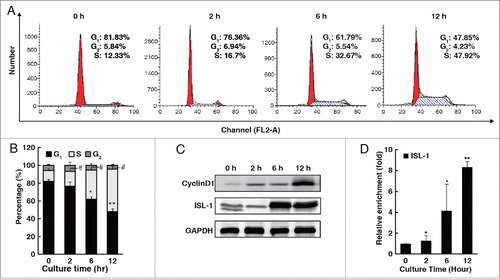
Figure 2. ISL-1 formed a complex with Set7/9 and PDX-1. (A) Co-IP assay was employed to detect the interactions among ISL-1, Set7/9 and PDX-1 in HIT-T15 cells. (B) Soluble chromatin was prepared from HIT-T15 cells followed by immunoprecipitation with antibodies against ISL-1, Set7/9 or PDX-1; normal IgG (Rb, rabbit; M, mouse) served as a control. (C) ChIP-re-IP assay was performed with anti-ISL-1 or rabbit IgG antibodies and then with anti-Set7/9, anti-PDX-1 or IgG antibodies for immunoprecipitation using chromatin harvested from HIT-T15 cells. (D) Full-length or truncated ISL-1 was used to construct GST-fusion proteins (Left panel) for pull-down assays with Set7/9 or PDX-1 protein (right panel). (E) Full-length or truncated Set7/9 was used to construct GST-fusion proteins for pull-down assays with ISL-1 protein. (F) The plasmids expressing ISL-1 mutants in which the Set7/9 binding sites were mutated or deleted (Left panel) were constructed and Co-IP assays were performed to detect the interaction between ISL-1 (wild-type or mutants) and Set7/9. The normal IgG was served as a negative control. ISL-1 and GAPDH served as loading and negative controls, respectively (right panel). (G) pcDNA3.1-ISL-1, pcDNA3.1-PDX-1 or pCMV-Set7/9 plasmids were transfected into HeLa cells in different combinations. Whole cell extracts were harvested after 48 h and subjected to Co-IP using anti-ISL-1 as the “IP” antibody and anti-PDX-1 as the “IB” antibody.
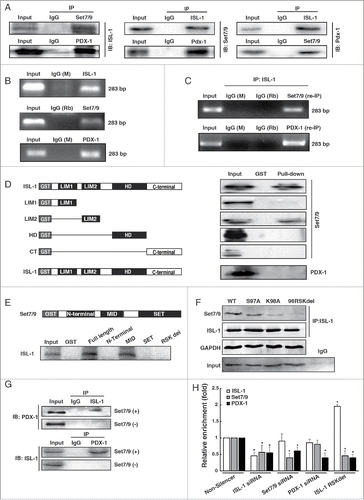
Figure 3. ISL-1 recruited Set7/9 to modulate histone modification of the CyclinD1 promoter. (A) H3k4me3 was detected by ChIP assay in HIT-T15 cells at indicated time-points after serum starvation for 48 h. The H3K4me3 level at 0 h serum starvation served as a control. (B, C) pcDNA3.1-ISL-1 (ISL-1), pcDNA3.1-vector (control), ISL-1 siRNA or Non-silencer negative control siRNA were transfected into HIT-T15 cells. ChIP assays were employed to detect H3k4me1 or H3k4me3 after 48 h. (D) The luciferase activity of the CylinD1 promoter was measured in 293A cells transfected with the indicated plasmid combination. The cells transfected with pcDNA3 were used as a negative control. (E) NIT-1 cells was transfected with pCMV-Set7/9 (pCMV-vector served as a control) or Set7/9 siRNA (Non-silencer served as a control), and Western blotting analysis was performed using an antibody against H3k4me3. Histone H3 was used as a loading control. (F, G) NIT-1 cells were transfected with different combinations of plasmids for 48 h, and H3k4me3 or H3k4me1 of the CyclinD1 promoter were measured by ChIP assay. The cells transfected with pcDNA3 or Non-silencer were used as negative controls. *p < 0.05, **p < 0.01, vs. pcDNA3; #p < 0.05, ##p < 0.01 vs. Non-silencer, NS: non-significance.
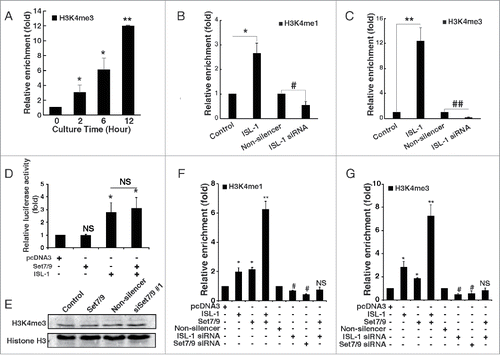
Figure 4. PDX-1 interacted with ISL-1 to promote the recruitment of RNA pol II. (A) NIT-1 cells were transfected with appropriate plasmids. The binding of RNA pol II to the ISL-1 site on the CyclinD1 promoter was measured by ChIP assay using an anti-RBP2 antibody. (B) ChIP assay was performed to analyze H3k4me3 of the CyclinD1 promoter region in NIT-1 cells transfected with indicated combination of plasmids. (C) Luciferase dual reporter assays were performed in 293A cells at 48 h after transfection with luc-CyclinD1-promoter and other plasmids. (D) Luciferase dual reporter assays were performed in NIT-1 cells at 48 h after transfection with luc-CyclinD1-promoter (wild-type), luc-cyclinD1-promoter in which the ISL-1 binding site TAAT was mutated to TGGT (Mutant-1) or deleted (Mutant-2) and other plasmids as shown including ISL-1 mt (the Set7/9 binding site RSK was deleted). The data represent 3 independent experiments, each performed in triplicate. *p < 0.05, **p < 0.01, vs. pcDNA3; #p < 0.05, ##p < 0.01 vs. Non-silencer or indicated column, NS, non-significance.
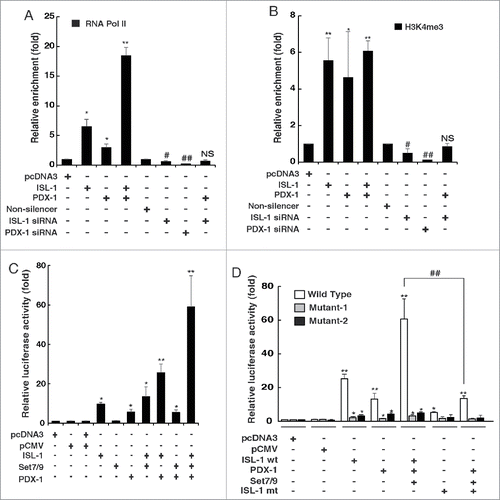
Figure 5. Set7/9 and PDX-1 promoted the effects of ISL-1 on β-cell proliferation. (A, B) The proliferation of NIT-1 cells transfected with the indicated plasmids in 96-well plates was analyzed with CCK-8 kits. (C, D) NIT-1 cells in 6-wells plates were transfected with the indicated plasmids. The cell confluence was measured using the Genetix clone selector after 48 h. The data represent 3 independent experiments, each performed in triplicate. *p < 0.05, **p < 0.01 vs. pcDNA3, #p < 0.05, ##p < 0.01 vs. non-silencer, NS, non-significance. +p < 0.05, ++p < 0.01 as indicated.
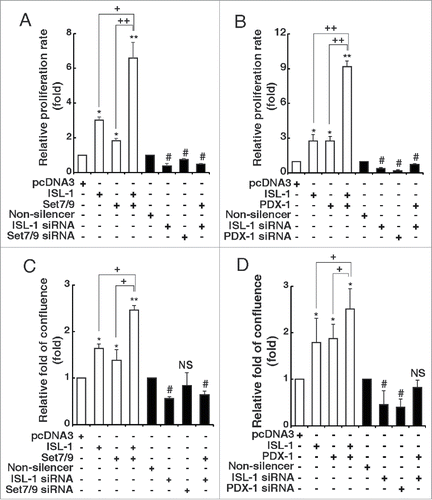
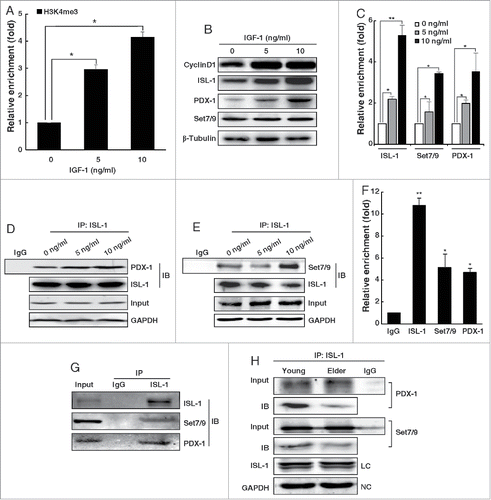
Figure 6. The formation of ISL-1/Set7/9/PDX-1 complex was regulated by IGF-1 in an age-related manner. (A) NIT-1 cells were treated with mouse recombinant IGF-1 protein. The H3k4me3 of the CyclinD1 promoter was verified by ChIP assay. (B) The whole cell lysates of NIT-1 cells treated with IGF-1 were used for Western blotting. (C) The enrichment of ISL-1, Set7/9 and PDX-1 at the CyclinD1 promoter was monitored by ChIP assay in NIT-1 cells treated with IGF-1. (D, E) Co-IP assays were performed to measure the ISL-1/Set7/9/PDX-1 complex in NIT-1 cells treated with IGF-1. ISL-1 and GAPDH served as a loading control and negative controls, respectively. (F) Rat islet lysates were subjected to ChIP assay using anti-ISL-1, PDX-1, Set7/9 antibodies or normal IgG. (G) Rat islet lysates were immunoprecipitated by anti-ISL-1 antibody. Western blotting was employed to detect the endogenous interaction using anti-PDX-1 or anti-Set7/9 antibodies. (H) The formation of the ISL-1/PDX-1/Set7/9 complex was detected by Co-IP assay in the islets of “young” or “old” rats. The data in (A), (C) and (F) represent 3 independent experiments, each performed in triplicate. *p < 0.05, **p < 0.01, #p < 0.05, ##p < 0.01 vs. the control, NS, non-significance.