1,532
Views
44
CrossRef citations to date
0
Altmetric
Report

Dysregulation of autophagy by HIV-1 Nef in human astrocytes

, &
Pages 2899-2904 | Received 01 Apr 2015, Accepted 01 Jul 2015, Published online: 20 Aug 2015

Figures & data

Figure 1. Effect of HIV-1 Nef expression on autophagy in Primary Human Astrocytes (PHFA). (A) Immunocytochemistry. PHFA cells were plated in 2 well chamber slides in astrocyte growth medium. Adenovirus transductions and fixing the cells were performed as described in the Materials and Methods. The fixed cells were probed with anti-GFAP antibody for astrocyte marker and anti-HIV-1 Nef (SF2) then mounted on slides using DAPI solution. The slides were visualized using a fluorescence microscopy. Green is GFAP; Red is HIV-1 Nef and blue is DAPI. (B) Immunoblotting of Cell lysates obtained from PHFA transduced with Ad-Nef or Ad-Null. PHFA cells were harvested and lysed using TNN buffer containing 1% NP40 supplemented with mammalian protease inhibitors at 4°C followed by SDS-PAGE and Western blots as described in Materials and Methods. Three different cultures of PHFA were used. The results are representative of at least 3 independent experiments. (C) MTT Assay. MTT proliferation assay was performed as described in Materials and Methods. The experiments were performed in duplicates in a 96 well plate and averages are shown as bar graphs. MTT activity is described differences in absorbances between 620 nm and 595 nm. (D) PHFA cells were transduced with Adnull and AdNef, harvested and lysed at 10, 24, and 48 hrs post-transductions (hpt) using TNN buffer containing 1% NP40 supplemented with mammalian protease inhibitors at 40C followed by SDS-PAGE and Western Blots as described in Materials and Methods.
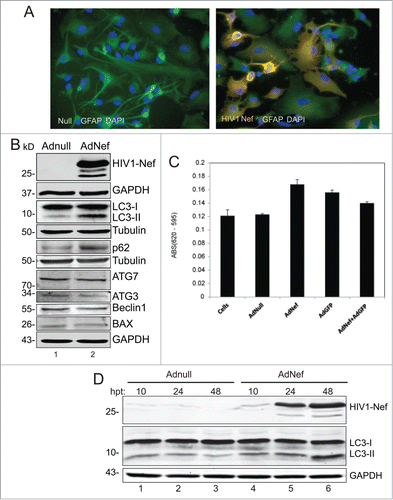
Figure 1. Effect of HIV-1 Nef expression on autophagy in Primary Human Astrocytes (PHFA). (A) Immunocytochemistry. PHFA cells were plated in 2 well chamber slides in astrocyte growth medium. Adenovirus transductions and fixing the cells were performed as described in the Materials and Methods. The fixed cells were probed with anti-GFAP antibody for astrocyte marker and anti-HIV-1 Nef (SF2) then mounted on slides using DAPI solution. The slides were visualized using a fluorescence microscopy. Green is GFAP; Red is HIV-1 Nef and blue is DAPI. (B) Immunoblotting of Cell lysates obtained from PHFA transduced with Ad-Nef or Ad-Null. PHFA cells were harvested and lysed using TNN buffer containing 1% NP40 supplemented with mammalian protease inhibitors at 4°C followed by SDS-PAGE and Western blots as described in Materials and Methods. Three different cultures of PHFA were used. The results are representative of at least 3 independent experiments. (C) MTT Assay. MTT proliferation assay was performed as described in Materials and Methods. The experiments were performed in duplicates in a 96 well plate and averages are shown as bar graphs. MTT activity is described differences in absorbances between 620 nm and 595 nm. (D) PHFA cells were transduced with Adnull and AdNef, harvested and lysed at 10, 24, and 48 hrs post-transductions (hpt) using TNN buffer containing 1% NP40 supplemented with mammalian protease inhibitors at 40C followed by SDS-PAGE and Western Blots as described in Materials and Methods.

Figure 2. HIV-1 Nef mimics the BafA1 to block autophagy in primary human astrocytes. PFHA were plated in 6-well plates as described earlier and transduced with Ad-Nef or Ad-Null when the cells were confluent. In this experiment, 3 times more (3 × 10⁶ U) Ad-Nef was used to maximize Nef expression (Lane 3) and BafA1 (10 nM) treatment in untransduced cells was shown in Lane 4. Controls are shown in lane 1, untransduced PHFA and lane 2, Ad-null transduced PHFA Lane 2. Cells were harvested after 24 hours and analyzed by SDS-PAGE/Western Blotting as described before. Immunoblotting was performed using anti-HIV-1 Nef, anti-LC3B and anti p62 antibodies along with loading controls β-tubulin and GAPDH similar to shown in . These results are representative of at least 3 different independent experiments.
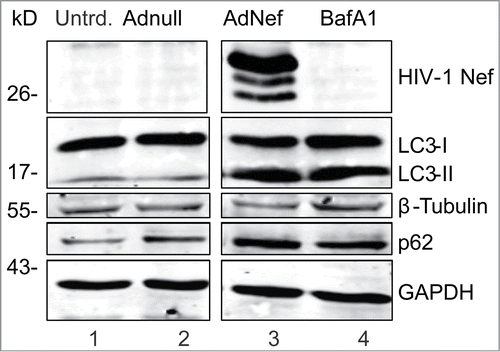
Figure 2. HIV-1 Nef mimics the BafA1 to block autophagy in primary human astrocytes. PFHA were plated in 6-well plates as described earlier and transduced with Ad-Nef or Ad-Null when the cells were confluent. In this experiment, 3 times more (3 × 10⁶ U) Ad-Nef was used to maximize Nef expression (Lane 3) and BafA1 (10 nM) treatment in untransduced cells was shown in Lane 4. Controls are shown in lane 1, untransduced PHFA and lane 2, Ad-null transduced PHFA Lane 2. Cells were harvested after 24 hours and analyzed by SDS-PAGE/Western Blotting as described before. Immunoblotting was performed using anti-HIV-1 Nef, anti-LC3B and anti p62 antibodies along with loading controls β-tubulin and GAPDH similar to shown in Fig. 1B. These results are representative of at least 3 different independent experiments.

Figure 3. Effect of HIV-1 Nef expression on mRFP-EGFP-LC3 puncta in PHFA cells by Immunocytochemistry (ICC). (A) PHFA cells were plated in 2 well chamber slides the day before the transfection. The cells were first transfected with ptfLC3 plasmid using Lipofectamine™ 3000 according to the manufacturer's guidelines followed by transduction with Ad-null or Ad-Nef and immunocytochemistry was performed as described in Materials and Methods. The upper panel shows the ICC of the Ad-Nef transduced primary astrocytes. From left to right purple for HIV-1 Nef, green for EGFP, red for mRFP, blue for DAPI, and merging EGFP-mRFP-DAPI where puncta were shown. The bottom panel is control with Ad-null transduced PHFA and the slides followed the same order. The far right panels depict the zoom-in where yellow puncta are shown in detail as indicated by arrows. (B) Percentage of Green-red-yellow puncta signal over total puncta per cell in merged images was calculated and shown as a bar graph. Data are shown as mean ± SD and are representative of at least 10 different cells from 10 different fields.
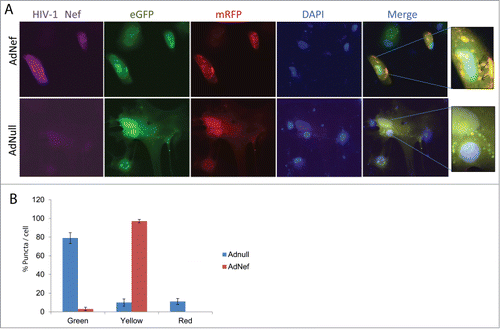
Figure 3. Effect of HIV-1 Nef expression on mRFP-EGFP-LC3 puncta in PHFA cells by Immunocytochemistry (ICC). (A) PHFA cells were plated in 2 well chamber slides the day before the transfection. The cells were first transfected with ptfLC3 plasmid using Lipofectamine™ 3000 according to the manufacturer's guidelines followed by transduction with Ad-null or Ad-Nef and immunocytochemistry was performed as described in Materials and Methods. The upper panel shows the ICC of the Ad-Nef transduced primary astrocytes. From left to right purple for HIV-1 Nef, green for EGFP, red for mRFP, blue for DAPI, and merging EGFP-mRFP-DAPI where puncta were shown. The bottom panel is control with Ad-null transduced PHFA and the slides followed the same order. The far right panels depict the zoom-in where yellow puncta are shown in detail as indicated by arrows. (B) Percentage of Green-red-yellow puncta signal over total puncta per cell in merged images was calculated and shown as a bar graph. Data are shown as mean ± SD and are representative of at least 10 different cells from 10 different fields.

Reprints and Corporate Permissions

Please note: Selecting permissions does not provide access to the full text of the article, please see our help page How do I view content?

To request a reprint or corporate permissions for this article, please click on the relevant link below:

Academic Permissions

Please note: Selecting permissions does not provide access to the full text of the article, please see our help page How do I view content?

Obtain permissions instantly via Rightslink by clicking on the button below:

If you are unable to obtain permissions via Rightslink, please complete and submit this Permissions form. For more information, please visit our Permissions help page.