1,453
Views
18
CrossRef citations to date
0
Altmetric
Extra View

The crucial role of Activin A on the formation of primordial germ cell-like cells from skin-derived stem cells in vitro

, , , , , , , , , , , & show all
Pages 3016-3029 | Received 18 Mar 2015, Accepted 26 Jul 2015, Published online: 23 Oct 2015

Figures & data

Figure 1. Skin-derived stem cells (SDSCs) can be induced into primordial germ cell-like cells (PGCLCs). (A). Schematic diagram of the experiments. Different concentrations of Activin A (ActA) was added at the embryoid body-like structure (EBLS) differentiation stage or the co-cultured stage. (B) SDSCs were isolated and cultured in a suspension culture system and passaged for 2 generations. Non-adherent spheres (a) were formed with GFP fluorescence (a’). These cells were cultured in a differentiation medium to form EBLSs (b). (c–e) cells of 4 days in EBLSs were isolated and co-cultured with MEF feeder cells for 4, 8 and 12 days. (f) The round PGCLCs in suspension appeared at day 12.
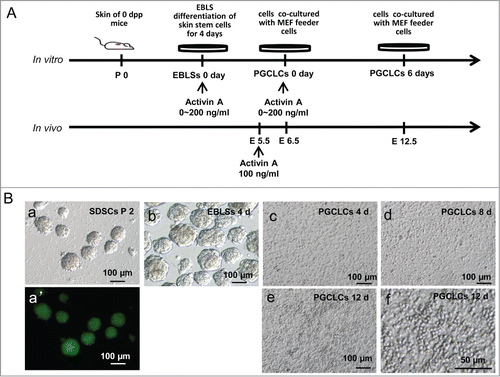
Figure 1. Skin-derived stem cells (SDSCs) can be induced into primordial germ cell-like cells (PGCLCs). (A). Schematic diagram of the experiments. Different concentrations of Activin A (ActA) was added at the embryoid body-like structure (EBLS) differentiation stage or the co-cultured stage. (B) SDSCs were isolated and cultured in a suspension culture system and passaged for 2 generations. Non-adherent spheres (a) were formed with GFP fluorescence (a’). These cells were cultured in a differentiation medium to form EBLSs (b). (c–e) cells of 4 days in EBLSs were isolated and co-cultured with MEF feeder cells for 4, 8 and 12 days. (f) The round PGCLCs in suspension appeared at day 12.

Figure 2. Characterization of PGCLCs. (A) SSEA-1 positive cells sorted by miniMACS expressed STELLA, DAZL and MVH. (B) The expression level of pluripotency marker Oct 4 and the PGC early markers Fragllis, Stella, Figla, Nobox and Dazl increased following 15 days in SSEA-1 positive cells.
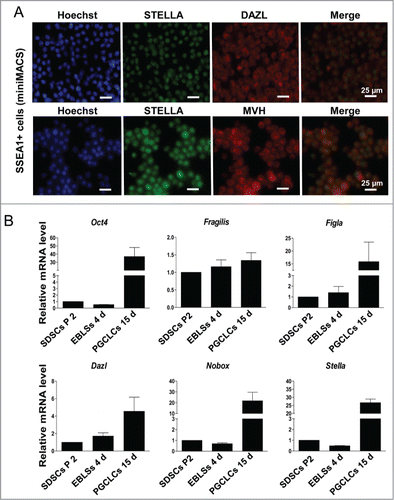
Figure 2. Characterization of PGCLCs. (A) SSEA-1 positive cells sorted by miniMACS expressed STELLA, DAZL and MVH. (B) The expression level of pluripotency marker Oct 4 and the PGC early markers Fragllis, Stella, Figla, Nobox and Dazl increased following 15 days in SSEA-1 positive cells.

Figure 3. Epigenetic modification of PGCLCs. Immunofluorescence of (A) 5mC, (B) 5hmC and (C) H3K27me3 in SDSCs passaged 2 generations, EBLCs, PGCLCs co-cultured for 6 days and E 12.5 PGCs as a control. (D) The statistics of fluorescence intensity (gray value) of immunofluorescence staining. The expression level of 5mC decreased from SDSCs to PGCLCs, which was similar to PGC development in vivo, and was low in PGCLCs as well as PGCs. Conversely, 5hmC and H3K27me3 increased during the differentiation process, and the expression profile was in accordance with E 12.5 PGCs.
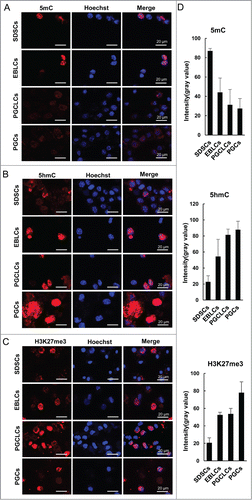
Figure 3. Epigenetic modification of PGCLCs. Immunofluorescence of (A) 5mC, (B) 5hmC and (C) H3K27me3 in SDSCs passaged 2 generations, EBLCs, PGCLCs co-cultured for 6 days and E 12.5 PGCs as a control. (D) The statistics of fluorescence intensity (gray value) of immunofluorescence staining. The expression level of 5mC decreased from SDSCs to PGCLCs, which was similar to PGC development in vivo, and was low in PGCLCs as well as PGCs. Conversely, 5hmC and H3K27me3 increased during the differentiation process, and the expression profile was in accordance with E 12.5 PGCs.

Figure 4. ActA promotes PGCLC formation. (A) Different concentrations of ActA was added during EBLS differentiation. Suspended and round cells increased with increasing ActA concentration in the EBLS differentiation stage and the co-cultured for 6 days without ActA addition. (B) PGCLCs co-cultured with MEFs for 4 to 16 days. Suspended cell numbers increased with 0 to 100 ng/ml ActA supplementation from 4 to 12 days, but decreased at 16 days. (C, D) FACS analysis of the percentage of SSEA-1 positive cells during EBLS differentiation with different ActA concentrations. (E, F) FACS analysis of the percentage of SSEA-1 positive cells during PGCLCs co-cultured with different ActA concentrations.
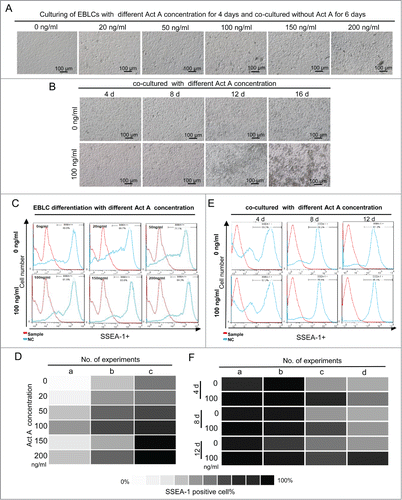
Figure 4. ActA promotes PGCLC formation. (A) Different concentrations of ActA was added during EBLS differentiation. Suspended and round cells increased with increasing ActA concentration in the EBLS differentiation stage and the co-cultured for 6 days without ActA addition. (B) PGCLCs co-cultured with MEFs for 4 to 16 days. Suspended cell numbers increased with 0 to 100 ng/ml ActA supplementation from 4 to 12 days, but decreased at 16 days. (C, D) FACS analysis of the percentage of SSEA-1 positive cells during EBLS differentiation with different ActA concentrations. (E, F) FACS analysis of the percentage of SSEA-1 positive cells during PGCLCs co-cultured with different ActA concentrations.

Figure 5. Immunofluorescence staining for MVH and SSEA-1 markers used for characterizing transdifferentiated PGCLCs. (A) The expression of MVH and SSEA-1 in PGCLCs co-cultured for 6 days with or without Act A, E 12.5 PGCs and SDSCs. And (B) the percentage of MVH/SSEA-1 double-positive cells was increased with 100 ng/ml ActA treatment compared with 0 ng/ml. **P < 0.01.
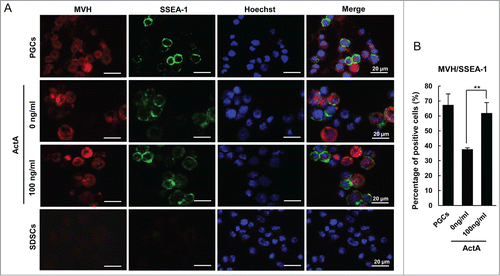
Figure 5. Immunofluorescence staining for MVH and SSEA-1 markers used for characterizing transdifferentiated PGCLCs. (A) The expression of MVH and SSEA-1 in PGCLCs co-cultured for 6 days with or without Act A, E 12.5 PGCs and SDSCs. And (B) the percentage of MVH/SSEA-1 double-positive cells was increased with 100 ng/ml ActA treatment compared with 0 ng/ml. **P < 0.01.

Figure 6. ActA promotes PGC generation in vivo. (A) Immunofluorescence of OCT4 in E 12.5 genital ridge cells. Pregnant mice were treated with 100 ng/kg ActA by tail vein injection from E 5.5 to E 11.5. The genital ridges were isolated at E 12.5 and digested into single cells. (B) The percentage of OCT4 positive cell increased by ActA treatment. (*P < 0.05). (C) Immunofluorescence of SSEA-1 in E 12.5 genital ridges. (D) The average number of SSEA-1 positive cells in one section also increased by ActA treatment. *P < 0.05.
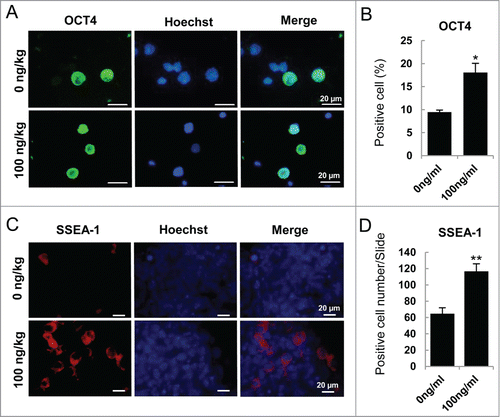
Figure 6. ActA promotes PGC generation in vivo. (A) Immunofluorescence of OCT4 in E 12.5 genital ridge cells. Pregnant mice were treated with 100 ng/kg ActA by tail vein injection from E 5.5 to E 11.5. The genital ridges were isolated at E 12.5 and digested into single cells. (B) The percentage of OCT4 positive cell increased by ActA treatment. (*P < 0.05). (C) Immunofluorescence of SSEA-1 in E 12.5 genital ridges. (D) The average number of SSEA-1 positive cells in one section also increased by ActA treatment. *P < 0.05.

Figure 7. The expression of epiblast marker genes and epigenetic modification key gene TET1. (A) Q-PCR analysis of epiblast marker genes, Dnmt3a, Dnmt3b, Wnt3 and Fgf5. Cells from SDSCs, E 5.5 and E 12.5 were analyzed and E 5.5 and E 12.5 were used as epiblast control and PGCs control, respectively. ActA promoted epiblast marker genes expression both in EBLS differentiation and the co-culture stage. But, Wnt3 was not upregulated in 6 day PGCLCs whether treated with ActA or not. (B) Q-PCR analysis of TET1. The expression level was high in E 12.5 PGCs and SDSCs. In cells differentiated in vitro, its mRNA level was relatively low compared to that in vivo. But ActA treatment resulted in an elevating TET1 expression level.
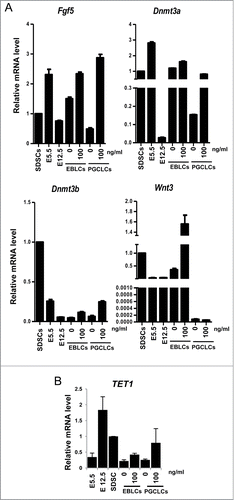
Figure 7. The expression of epiblast marker genes and epigenetic modification key gene TET1. (A) Q-PCR analysis of epiblast marker genes, Dnmt3a, Dnmt3b, Wnt3 and Fgf5. Cells from SDSCs, E 5.5 and E 12.5 were analyzed and E 5.5 and E 12.5 were used as epiblast control and PGCs control, respectively. ActA promoted epiblast marker genes expression both in EBLS differentiation and the co-culture stage. But, Wnt3 was not upregulated in 6 day PGCLCs whether treated with ActA or not. (B) Q-PCR analysis of TET1. The expression level was high in E 12.5 PGCs and SDSCs. In cells differentiated in vitro, its mRNA level was relatively low compared to that in vivo. But ActA treatment resulted in an elevating TET1 expression level.

Figure 8. Positive effects of ActA were repressed by Smad3 RNAi. (A) Treating cells with 100 ng/ml ActA for 10 days and then adding siRNA that specifically targets to Smad3, or nonsense siRNA as negative control and cultured without RNAi as a control to eliminate the influence of RNAi system on cell culture, and continue culturing for 2 days. (B) The protein level of SMAD3 is downregulated by RNAi. (C and D) FACS analysis of SSEA-1/GFP double-positive cells 48 hrs after Smad3 RNAi. (E) Cell cycle genes, CCND1 and CDK2, the marker gene of proliferation, decreased significantly by Smad3 RNAi. n = 3. *P < 0.05.
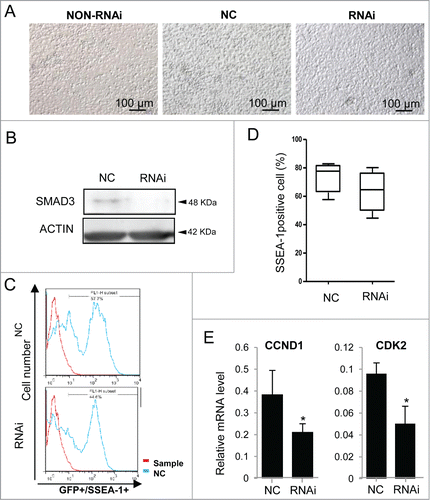
Figure 8. Positive effects of ActA were repressed by Smad3 RNAi. (A) Treating cells with 100 ng/ml ActA for 10 days and then adding siRNA that specifically targets to Smad3, or nonsense siRNA as negative control and cultured without RNAi as a control to eliminate the influence of RNAi system on cell culture, and continue culturing for 2 days. (B) The protein level of SMAD3 is downregulated by RNAi. (C and D) FACS analysis of SSEA-1/GFP double-positive cells 48 hrs after Smad3 RNAi. (E) Cell cycle genes, CCND1 and CDK2, the marker gene of proliferation, decreased significantly by Smad3 RNAi. n = 3. *P < 0.05.

Figure 9. ActA has no effect on PGCLCs formation from Smad3 knockout mouse SDSCs. (A) Co-cultured of PGCLCs that derived from Smad3 knockout mouse SDSCs with 0 or 100 ng/ml ActA for 12 days. (B and C) FACS analysis of SSEA-1 positive cells. Treatment with ActA has no obvious effects on PGCLC formation. (D) Expression levels of PGC markers, Stella, Oct4 and Dazl did not increase obviously with ActA treatment compared with control. n = 3. (E) Expression levels of epiblast markers Wnt3, Fgf5 and Dnmt3a did not increase obviously with 100 ng/ml ActA treatment in PGCLCs that derived from Smad3 knockout mouse SDSC and co-cultured for 12 days compared with control. n = 3.
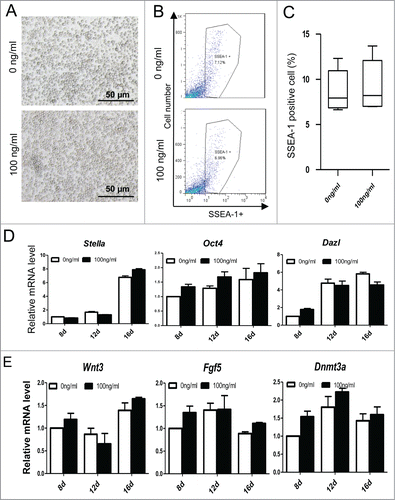
Figure 9. ActA has no effect on PGCLCs formation from Smad3 knockout mouse SDSCs. (A) Co-cultured of PGCLCs that derived from Smad3 knockout mouse SDSCs with 0 or 100 ng/ml ActA for 12 days. (B and C) FACS analysis of SSEA-1 positive cells. Treatment with ActA has no obvious effects on PGCLC formation. (D) Expression levels of PGC markers, Stella, Oct4 and Dazl did not increase obviously with ActA treatment compared with control. n = 3. (E) Expression levels of epiblast markers Wnt3, Fgf5 and Dnmt3a did not increase obviously with 100 ng/ml ActA treatment in PGCLCs that derived from Smad3 knockout mouse SDSC and co-cultured for 12 days compared with control. n = 3.

Figure 10. ActA promotes meiotic initiation of PGCLCs in vitro at a later induction stage. (A) Before 12 days culture, the PGCLCs percentage increased with increasing ActA dose, but from 12 to 16 days the percentage of PGCLCs was reduced in a dose dependent manner. (B) Q-PCR analysis of meiosis genes in PGCLCs cultured for 8 days, 12 days and 16 days. It shows that Scp3, Stra8, Dmc1 and Sycp1 increased from 12 days to 16 days with 100 ng/ml ActA present. (C) Q-PCR analysis of meiosis genes of PGCLCs cultured or 16 days with different ActA concentrations. Expression levels of these 4 genes increased from 0 ng/ml to 100 ng/ml but decreased with 200 ng/ml. So 100 ng/ml ActA has the most obvious effects on meiosis gene expression and meiotic entry. (D) Q-PCR analysis of RA receptors. RAR α, and RAR γ were determined and elevated markedly at 16 days with 100 ng/ml ActA, and RAR β was up-regulated to a different extent at 8 days, 12 days and 16 days with 100 ng/ml ActA. Data of day 8 with 0 ng/ml ActA was normalized as 1, n = 3. * P < 0.05.
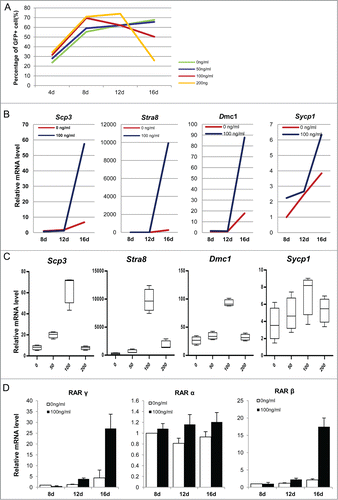
Figure 10. ActA promotes meiotic initiation of PGCLCs in vitro at a later induction stage. (A) Before 12 days culture, the PGCLCs percentage increased with increasing ActA dose, but from 12 to 16 days the percentage of PGCLCs was reduced in a dose dependent manner. (B) Q-PCR analysis of meiosis genes in PGCLCs cultured for 8 days, 12 days and 16 days. It shows that Scp3, Stra8, Dmc1 and Sycp1 increased from 12 days to 16 days with 100 ng/ml ActA present. (C) Q-PCR analysis of meiosis genes of PGCLCs cultured or 16 days with different ActA concentrations. Expression levels of these 4 genes increased from 0 ng/ml to 100 ng/ml but decreased with 200 ng/ml. So 100 ng/ml ActA has the most obvious effects on meiosis gene expression and meiotic entry. (D) Q-PCR analysis of RA receptors. RAR α, and RAR γ were determined and elevated markedly at 16 days with 100 ng/ml ActA, and RAR β was up-regulated to a different extent at 8 days, 12 days and 16 days with 100 ng/ml ActA. Data of day 8 with 0 ng/ml ActA was normalized as 1, n = 3. * P < 0.05.
Supplemental material

1078031_supplemental_files.zip

Download Zip (21.7 MB)

Reprints and Corporate Permissions

Please note: Selecting permissions does not provide access to the full text of the article, please see our help page How do I view content?

To request a reprint or corporate permissions for this article, please click on the relevant link below:

Academic Permissions

Please note: Selecting permissions does not provide access to the full text of the article, please see our help page How do I view content?

Obtain permissions instantly via Rightslink by clicking on the button below:

If you are unable to obtain permissions via Rightslink, please complete and submit this Permissions form. For more information, please visit our Permissions help page.