920
Views
6
CrossRef citations to date
0
Altmetric
Report

Erk5 contributes to maintaining the balance of cellular nucleotide levels and erythropoiesis

, , , , , , & show all
Pages 3864-3876 | Received 26 Mar 2015, Accepted 12 Nov 2015, Published online: 23 Dec 2015

Figures & data

Figure 1. Erk5 depletion sensitizes Jurkat cells to thymidine. (A) Western blot of Erk5 in representative shCtrl and shErk5 cell lines. The blot was reprobed with anti-actin as loading control and the intensity of the protein bands was quantified using quantitative luminescence. (Right) The analysis was repeated with 10 different shErk5 cell lines and 9 different shCtrl cell lines, and the ratio Erk5:actin ± s.d. is shown, *p<0.05. (B) Erk5 mRNA expression as analyzed by reverse transcription and real-time PCR. Erk5:18S values were calculated and normalized to shCtrl, which was given an arbitrary value of 1.0. The analysis was repeated with 10 shErk5 and 9 shCtrl cell lines, and the mean ± s.d. is presented, ***p<0.001. (C) Representative cell cycle profiles of shCtrl and shErk5 cells in asynchronous culture as well as after 18 h, 24 h and 28 h treatment with 2.5 mM thymidine, as analyzed by PI staining and flow cytometry. (Right) Quantification of the subG1 fraction in each condition, n=6, **p<0.01. (D) Annexin V/DAPI analysis of cells after 18h treatment with 1.5 mM thymidine. (Right) Quantification of viability of shCtrl, shERK5 and shErk5+shErk5 cells n=3, *p<0.05 for live cells. (E) Western blot of Erk5 in cell lines shCtrl, shErk5 and shErk5 transfected with Erk5. The blot was reprobed with anti-Gapdh as loading control. (A-B) Unpaired Student's t-test, (C-D) Paired Student's t-test.
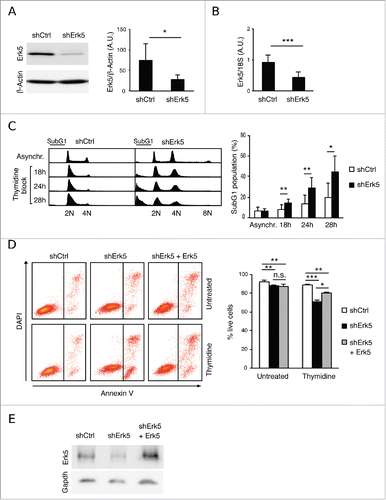
Figure 1. Erk5 depletion sensitizes Jurkat cells to thymidine. (A) Western blot of Erk5 in representative shCtrl and shErk5 cell lines. The blot was reprobed with anti-actin as loading control and the intensity of the protein bands was quantified using quantitative luminescence. (Right) The analysis was repeated with 10 different shErk5 cell lines and 9 different shCtrl cell lines, and the ratio Erk5:actin ± s.d. is shown, *p<0.05. (B) Erk5 mRNA expression as analyzed by reverse transcription and real-time PCR. Erk5:18S values were calculated and normalized to shCtrl, which was given an arbitrary value of 1.0. The analysis was repeated with 10 shErk5 and 9 shCtrl cell lines, and the mean ± s.d. is presented, ***p<0.001. (C) Representative cell cycle profiles of shCtrl and shErk5 cells in asynchronous culture as well as after 18 h, 24 h and 28 h treatment with 2.5 mM thymidine, as analyzed by PI staining and flow cytometry. (Right) Quantification of the subG1 fraction in each condition, n=6, **p<0.01. (D) Annexin V/DAPI analysis of cells after 18h treatment with 1.5 mM thymidine. (Right) Quantification of viability of shCtrl, shERK5 and shErk5+shErk5 cells n=3, *p<0.05 for live cells. (E) Western blot of Erk5 in cell lines shCtrl, shErk5 and shErk5 transfected with Erk5. The blot was reprobed with anti-Gapdh as loading control. (A-B) Unpaired Student's t-test, (C-D) Paired Student's t-test.

Figure 2. Thymidine increases DNA damage in Erk5-depleted Jurkat cells. (A) Viability of cells after 18 h treatment with 5 μg/mL aphidicolin or 2 mM HU. (Left) Annexin V/DAPI analysis of cells treated with aphidicolin or HU. The numbers inside the plot indicate the percentage of annexin V-positive cells in this particular experiment. (Right) Quantification of apoptosis, n=3, *p<0.05. (B) Representative western blot showing phospho-H2AX (p-H2AX) in shCtrl and shErk5 cell lines at the indicated times after release from an 18 h thymidine block. Histone 3 was used as loading control. (Right) Densitometric analysis of the protein gel blot, the ratio phospho-H2AX:H3 ± s.d. is shown, n=3. (C) Representative cell cycle profiles after 0 h, 8 h, 16 h or 24 h release from 18 h thymidine block, as analyzed by PI staining and flow cytometry. (Right) Quantification of subG1 fraction after release from thymidine block, n=6. A pool of 2 shCtrl or 2 shErk5 cell lines was used in these experiments (A-C). Paired Student's t-test, *p<0.05 **p<0.01.
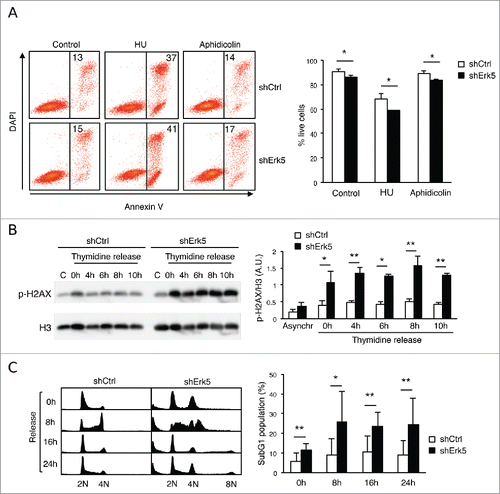
Figure 2. Thymidine increases DNA damage in Erk5-depleted Jurkat cells. (A) Viability of cells after 18 h treatment with 5 μg/mL aphidicolin or 2 mM HU. (Left) Annexin V/DAPI analysis of cells treated with aphidicolin or HU. The numbers inside the plot indicate the percentage of annexin V-positive cells in this particular experiment. (Right) Quantification of apoptosis, n=3, *p<0.05. (B) Representative western blot showing phospho-H2AX (p-H2AX) in shCtrl and shErk5 cell lines at the indicated times after release from an 18 h thymidine block. Histone 3 was used as loading control. (Right) Densitometric analysis of the protein gel blot, the ratio phospho-H2AX:H3 ± s.d. is shown, n=3. (C) Representative cell cycle profiles after 0 h, 8 h, 16 h or 24 h release from 18 h thymidine block, as analyzed by PI staining and flow cytometry. (Right) Quantification of subG1 fraction after release from thymidine block, n=6. A pool of 2 shCtrl or 2 shErk5 cell lines was used in these experiments (A-C). Paired Student's t-test, *p<0.05 **p<0.01.

Figure 3. shErk5 cells are more sensitive to a low thymidine concentration. (A) Proliferation of shCtrl, shErk5 and shErk5+Erk5 cells cultured in medium containing 100 μM thymidine ± 1 μM deoxynucleosides (N). Cells were seeded at a concentration of 0.2·106/mL and counted at 24 h, 48 h and 72 h, n=3. (B) Representative western blot showing phospho-H2AX levels in shCtrl and shErk5 lines after 24 h incubation with 100 µM thymidine. (Bottom) Quantification of the phospho-H2AX levels, mean ±s.d., n=3. (C) dNTP levels in normally growing shCtrl and shErk5 cells, mean ±s .d., n=3. (D) Thymidine strongly decreases dCTP in shErk5 cells. dNTP levels in shCtrl and shErk5 cells after 18 h treatment with thymidine, aphidicolin or HU. All values are normalized to the asynchronous control condition which has been given an arbitrary value of 1.0 (dotted gray line), n=5. (E) dTTP:dCTP ratio after 18 h treatment with thymidine, aphidicolin or HU, n=5. (F) Representative protein gel blots showing phospho-Chk1 and phosphor-H2AX levels in shCtrl, shErk5 and shErk5+Erk5 lines after 18 h incubation with thymidine and deoxynucleosides as indicated. The blots were reprobed with Chk1 or GAPDH for loading control. (Bottom) Quantification of the phosphor-H2AX levels, mean ±s.d., n=3, unpaired Student's t-test, * p<0.05 referred to the control sample shCtrl + 100 μM thymidine + deoxynucleosides (basal phosphorylation of H2AX). One each shCtrl, shErk5 and shErk5+Erk5 cell lines were used in experiments (A, F). Pools of 2 shCtrl or 2 shErk5 cell lines were used in experiments (B, C, D, E). (A-E) Paired Student's t-test, *p<0.05 **p<0.01 ***p<0.001.
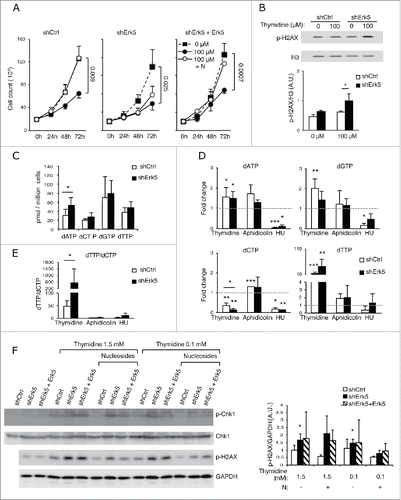
Figure 3. shErk5 cells are more sensitive to a low thymidine concentration. (A) Proliferation of shCtrl, shErk5 and shErk5+Erk5 cells cultured in medium containing 100 μM thymidine ± 1 μM deoxynucleosides (N). Cells were seeded at a concentration of 0.2·106/mL and counted at 24 h, 48 h and 72 h, n=3. (B) Representative western blot showing phospho-H2AX levels in shCtrl and shErk5 lines after 24 h incubation with 100 µM thymidine. (Bottom) Quantification of the phospho-H2AX levels, mean ±s.d., n=3. (C) dNTP levels in normally growing shCtrl and shErk5 cells, mean ±s .d., n=3. (D) Thymidine strongly decreases dCTP in shErk5 cells. dNTP levels in shCtrl and shErk5 cells after 18 h treatment with thymidine, aphidicolin or HU. All values are normalized to the asynchronous control condition which has been given an arbitrary value of 1.0 (dotted gray line), n=5. (E) dTTP:dCTP ratio after 18 h treatment with thymidine, aphidicolin or HU, n=5. (F) Representative protein gel blots showing phospho-Chk1 and phosphor-H2AX levels in shCtrl, shErk5 and shErk5+Erk5 lines after 18 h incubation with thymidine and deoxynucleosides as indicated. The blots were reprobed with Chk1 or GAPDH for loading control. (Bottom) Quantification of the phosphor-H2AX levels, mean ±s.d., n=3, unpaired Student's t-test, * p<0.05 referred to the control sample shCtrl + 100 μM thymidine + deoxynucleosides (basal phosphorylation of H2AX). One each shCtrl, shErk5 and shErk5+Erk5 cell lines were used in experiments (A, F). Pools of 2 shCtrl or 2 shErk5 cell lines were used in experiments (B, C, D, E). (A-E) Paired Student's t-test, *p<0.05 **p<0.01 ***p<0.001.

Figure 4. Low thymidine concentration decreased dCTP levels in shErk5 cells. (A) dNTP levels in shCtrl and shErk5 cells after 24 h treatment with 100 µM thymidine. All values are normalized to the asynchronous control condition which has been given an arbitrary value of 1.0 (dotted gray line), n=4. (B) dTTP:dCTP ratio after 18 h treatment with thymidine, n=4. (C) The addition of 1 µM deoxynucleosides (N: dA + dC + dG) rescues dCTP levels and decreases subG1 fraction in shERK5 cells. dNTP levels in shCtrl and shERK5 cells after 18 h treatment with 2.5 mM thymidine with or without the addition of deoxynucleosides. All values are normalized to the asynchronous control condition, which has been given an arbitrary value of 1.0 (dotted gray line), n=4. (D) dTTP:dCTP ratio after 18 h treatment with thymidine or thymidine + deoxynucleosides. (E) Cell viability after 18 h treatment with thymidine or thymidine + deoxynucleosides, n=3. Pools of 2 shCtrl or 2 shERK5 cell lines were used in experiments (A-D). One shCtrl and one shERK5 cell lines were used in experiments (E). Student's t-test *p<0.05.
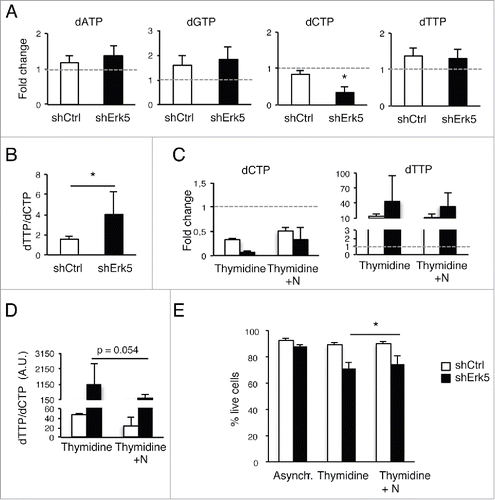
Figure 4. Low thymidine concentration decreased dCTP levels in shErk5 cells. (A) dNTP levels in shCtrl and shErk5 cells after 24 h treatment with 100 µM thymidine. All values are normalized to the asynchronous control condition which has been given an arbitrary value of 1.0 (dotted gray line), n=4. (B) dTTP:dCTP ratio after 18 h treatment with thymidine, n=4. (C) The addition of 1 µM deoxynucleosides (N: dA + dC + dG) rescues dCTP levels and decreases subG1 fraction in shERK5 cells. dNTP levels in shCtrl and shERK5 cells after 18 h treatment with 2.5 mM thymidine with or without the addition of deoxynucleosides. All values are normalized to the asynchronous control condition, which has been given an arbitrary value of 1.0 (dotted gray line), n=4. (D) dTTP:dCTP ratio after 18 h treatment with thymidine or thymidine + deoxynucleosides. (E) Cell viability after 18 h treatment with thymidine or thymidine + deoxynucleosides, n=3. Pools of 2 shCtrl or 2 shERK5 cell lines were used in experiments (A-D). One shCtrl and one shERK5 cell lines were used in experiments (E). Student's t-test *p<0.05.

Figure 5. Ineffective erythropoiesis in mice with Erk5-deficiency in haematopoietic cells. (A) Representative western blot showing the absence of Erk5 protein in a total lysate of bone marrow cells (left) and splenocytes (right) from an Erk5fl/fl mouse and an Erk5-/-VavCre mouse. (B-C) Cellularity in bone marrow (n≥6 ) (B) and spleen (n≥9 ) (C) of Erk5fl/fl and Erk5-/-VavCre mice. (D) Splenic weight normalized to body weight (n≥7 ). (E) Representative spleens of Erk5fl/fl and Erk5-/-VavCre mice. (F) Splenic erythroid population. Dot plots representing erythroid precursor distribution (EryA, EryB, EryC) based on forward scatter (FSC) and CD71 expression (top right) in the ter119 positive population (top left). Percentage of ter119+ population in Erk5fl/fl and Erk5-/-VavCre bone marrow (bottom left), and percentage of ter119+ subpopulations EryA, EryB, EryC (bottom right), n≥8 . (G) Bone marrow erythroid population. Dot plots representing erythroid precursor distribution (EryA, EryB, EryC) based on FSC and CD71 expression (top right) in the ter119+ population (top left). Percentage of ter119+ population in Erk5fl/fl and Erk5-/-VavCre bone marrow (bottom left), and percentage of ter119+ subpopulations EryA, EryB, EryC (bottom right), n≥8 . Paired Student's t-test, *p<0.05 **p<0.01 ***p<0.001.
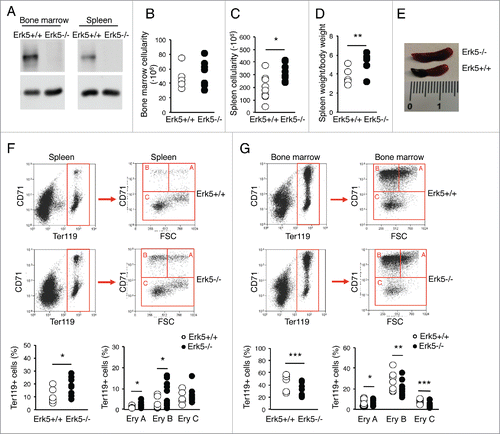
Figure 5. Ineffective erythropoiesis in mice with Erk5-deficiency in haematopoietic cells. (A) Representative western blot showing the absence of Erk5 protein in a total lysate of bone marrow cells (left) and splenocytes (right) from an Erk5fl/fl mouse and an Erk5-/-VavCre mouse. (B-C) Cellularity in bone marrow (n≥6 ) (B) and spleen (n≥9 ) (C) of Erk5fl/fl and Erk5-/-VavCre mice. (D) Splenic weight normalized to body weight (n≥7 ). (E) Representative spleens of Erk5fl/fl and Erk5-/-VavCre mice. (F) Splenic erythroid population. Dot plots representing erythroid precursor distribution (EryA, EryB, EryC) based on forward scatter (FSC) and CD71 expression (top right) in the ter119 positive population (top left). Percentage of ter119+ population in Erk5fl/fl and Erk5-/-VavCre bone marrow (bottom left), and percentage of ter119+ subpopulations EryA, EryB, EryC (bottom right), n≥8 . (G) Bone marrow erythroid population. Dot plots representing erythroid precursor distribution (EryA, EryB, EryC) based on FSC and CD71 expression (top right) in the ter119+ population (top left). Percentage of ter119+ population in Erk5fl/fl and Erk5-/-VavCre bone marrow (bottom left), and percentage of ter119+ subpopulations EryA, EryB, EryC (bottom right), n≥8 . Paired Student's t-test, *p<0.05 **p<0.01 ***p<0.001.

Figure 6. Distribution of B cell progenitors in bone marrow and spleen of Erk5-/-VavCre and control Erk5fl/fl mice. (A) Bone marrow B220+ population in Erk5fl/fl (n=7) and Erk5-/-VavCre (n=10) mice. (B) Percentage of bone marrow B cell precursors in Erk5fl/fl (n=7) and Erk5-/-VavCre (n=10) mice (top). Dot plots show lymphoid precursor distribution (B220lowIgM-, B220lowIgM+, B220highIgM+) in the bone marrow population (bottom). (C) Percentage of splenic B cells (n≥7 ) (left). Dot plots show lymphoid precursor distribution (B220lowIgM-, B220lowIgM+, B220highIgM+) in the splenic population (right). Paired Student's t-test, **p<0.01.
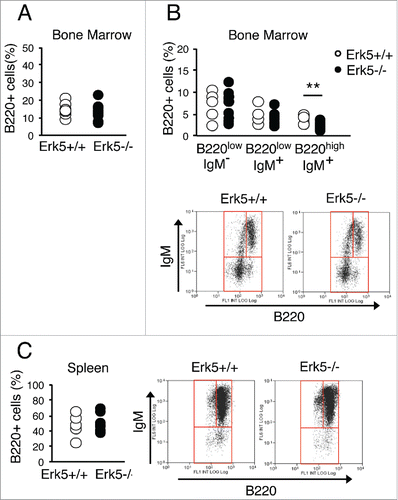
Figure 6. Distribution of B cell progenitors in bone marrow and spleen of Erk5-/-VavCre and control Erk5fl/fl mice. (A) Bone marrow B220+ population in Erk5fl/fl (n=7) and Erk5-/-VavCre (n=10) mice. (B) Percentage of bone marrow B cell precursors in Erk5fl/fl (n=7) and Erk5-/-VavCre (n=10) mice (top). Dot plots show lymphoid precursor distribution (B220lowIgM-, B220lowIgM+, B220highIgM+) in the bone marrow population (bottom). (C) Percentage of splenic B cells (n≥7 ) (left). Dot plots show lymphoid precursor distribution (B220lowIgM-, B220lowIgM+, B220highIgM+) in the splenic population (right). Paired Student's t-test, **p<0.01.

Figure 7. Absence of Erk5 alters cell cycle progression and increases mutation rate in erythroid precursors in vivo. (A-D) Percentage of bone marrow cells (A, n≥8 ), bone marrow ter119+ cells (B, n≥8 ), spleen cells (C, n≥8 ) and spleen ter119+ cells (D, n≥8 ) in each cell cycle phase of control Erk5fl/fl and Erk5-/-VavCre mice. (E) Percentage of cells in S/G2-phase in the spleen (top) and in the ter119+ fraction of the spleen (bottom). The numbers inside the plot indicate the percentage of cells BrdU+/DAPI+ (cells in S/G2-phase) in this particular experiment. The BrdU-positive cells were detected by incubation of permeabilized cells with mouse anti-BrdU antibody, followed by staining with Alexa 488-conjugated F(ab')2 anti-mouse antibody and analysis by flow cytometry. (Right) Mean of 3 mice +/-SD. (F) Analysis of apoptosis in bone marrow by Annexin V and PI staining (n=2 for each genotype). Paired t-test *p<0.05. (G) Intracellular dNTP levels in bone marrow ter119+ cells, n=3. dATP was undetectable in the samples. (H-I) Exome sequencing in ter119+ cells from the bone marrow. Number and type of mutations (H) and number and percentage (I) of single nucleotide variation (SNV) of a control heterozygous Erk5+/-VavCre and Erk5-/-VavCre mouse. Paired Student's t-test, *p<0.05.
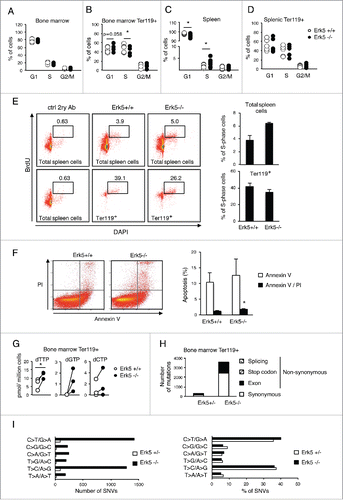
Figure 7. Absence of Erk5 alters cell cycle progression and increases mutation rate in erythroid precursors in vivo. (A-D) Percentage of bone marrow cells (A, n≥8 ), bone marrow ter119+ cells (B, n≥8 ), spleen cells (C, n≥8 ) and spleen ter119+ cells (D, n≥8 ) in each cell cycle phase of control Erk5fl/fl and Erk5-/-VavCre mice. (E) Percentage of cells in S/G2-phase in the spleen (top) and in the ter119+ fraction of the spleen (bottom). The numbers inside the plot indicate the percentage of cells BrdU+/DAPI+ (cells in S/G2-phase) in this particular experiment. The BrdU-positive cells were detected by incubation of permeabilized cells with mouse anti-BrdU antibody, followed by staining with Alexa 488-conjugated F(ab')2 anti-mouse antibody and analysis by flow cytometry. (Right) Mean of 3 mice +/-SD. (F) Analysis of apoptosis in bone marrow by Annexin V and PI staining (n=2 for each genotype). Paired t-test *p<0.05. (G) Intracellular dNTP levels in bone marrow ter119+ cells, n=3. dATP was undetectable in the samples. (H-I) Exome sequencing in ter119+ cells from the bone marrow. Number and type of mutations (H) and number and percentage (I) of single nucleotide variation (SNV) of a control heterozygous Erk5+/-VavCre and Erk5-/-VavCre mouse. Paired Student's t-test, *p<0.05.

Table 1. Summary of the number and type of mutations identified in Erk5-/-VavCre compared to a heterozygote control Erk5+/-VavCre mouse.

Supplemental material

1120914_Supplemental_Material.zip

Download Zip (470.9 KB)

Reprints and Corporate Permissions

Please note: Selecting permissions does not provide access to the full text of the article, please see our help page How do I view content?

To request a reprint or corporate permissions for this article, please click on the relevant link below:

Academic Permissions

Please note: Selecting permissions does not provide access to the full text of the article, please see our help page How do I view content?

Obtain permissions instantly via Rightslink by clicking on the button below:

If you are unable to obtain permissions via Rightslink, please complete and submit this Permissions form. For more information, please visit our Permissions help page.