Figures & data
Figure 1. Expression profiles of rpL3 and p21 in Calu-6 and HCT 116 p53-/- cells upon Act D treatment. (A) Calu-6 and (B) HCT 116 p53-/- cells were treated with 5 nM of Act D for 24 h or untreated. Protein extracts from untreated or treated cells were analyzed by western blotting with indicated antibodies. Anti-α-tubulin was used as loading control. Quantification of protein levels is shown. (C) Ribosome distribution profile of rpL3 protein upon Act D treatment. Calu-6 cells, untreated and treated with 5 nM of Act D for 12 and 36 h were collected, lysated (total fraction, TF) and fractionated to obtain the ribosome-associated fraction (RF) and ribosome-free fractions (FF). The fractions were analyzed by western blotting with the indicated antibodies. The per-cell ratio of the amount of protein loaded onto a gel was TF:RF:FF/1:10:1. Quantification of rpL3 protein levels in FF (panel on the right) is shown. Results illustrated in are representative of 3 independently performed experiments.
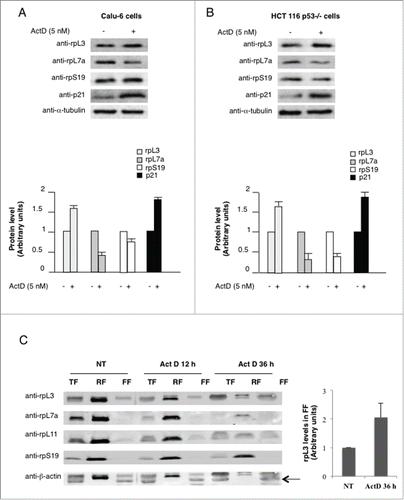
Figure 2. Analysis of the interaction between rpL3 and p21 gene promoter in response to ActD treatment. Protein samples of DNA-rpL3 or DNA-IgG immunocomplexes from (A) Calu-6 cells and (B) HCT 116 p53-/- untreated or treated with 5 nM Act D for 24 h were analyzed by western blotting assay with antibodies against rpL3. Note the absence of signal in DNA-IgG immunocomplex. The same DNA-immunoprecipitates were subjected to qPCR with primers specific for the proximal region of p21 gene promoter or control loci (p21 3'-UTR). (C) Calu-6 cells and (D) HCT 116 p53-/- cells were transiently cotransfected with the full-length p21 promoter luciferase reporter plasmid and siRNA specific for rpL3 (rpL3-siRNA) or scrambled siRNA (Scr-siRNA). Then, cells were treated with 5 nM of Act D for 24 h or untreated. Analysis of the relative luciferase activity, normalized against Renilla Luciferase (pRL) activity, of the samples is shown.

Figure 3. Analysis of the interaction between rpL3 and p21 proteins upon Act D treatment in vivo. (A) rpL3 was specifically immunoprecipitated from Calu-6 cells extracts with antibodies against the endogenous rpL3. Immunoprecipitates were separated by SDS–PAGE and immunoblotted with antibodies versus the indicated proteins. Note the absence of signal in IgG immunocomplex. (B) Analysis of the interaction between rpL3 and p21 proteins in vitro. GST-p21 or GST (control), were immobilized on glutathione-sepharose beads and incubated with His-rpL3 or His-NPM. The eluted proteins were then analyzed by immunoblot with antibodies anti-rpL3 and anti-NPM. Note the absence of signal in control GST pull-down preparations. (C) Effect of rpL3 on p21 half-life. Calu-6, rpL3ΔCalu-6 and Calu-6 cells treated with 5 nM of Act D for 24 h were incubated with CHX for the indicated times. Western blot was performed using anti-p21 antibody and anti-β-actin as loading control.
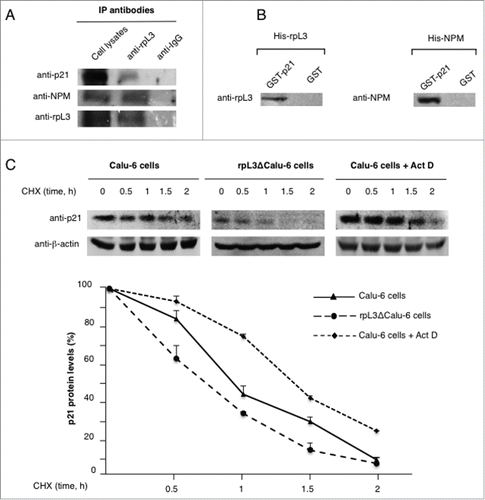
Figure 4. Influence of rpL3 on MDM2, pERK1/2 and p21 proteins upon Act D treatment. (A) Calu-6 cells were transiently transfected with pHa-rpL3. Calu-6, Calu-6/rpL3 and rpL3ΔCalu-6 were treated with 5 nM Act D for 24 h or untreated. Protein extracts from the samples were analyzed by western blot with indicated antibodies. Anti-vinculin was used as loading control. (B) Effect of rpL3 on ERK expression upon ERK inhibition. Calu-6 cells were transiently transfected with pHA-rpL3. 24 h later, untransfected and transfected cells were treated with 10 μM of the inhibitor PD18 for 1 and 3 h. Protein extracts from the samples were analyzed by western blot using anti-ERK1/2 and pERK1/2 antibodies. Anti-β-tubulin was used as loading control.
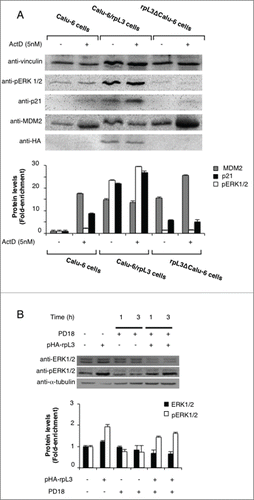
Figure 5. (A) Representative image of clonogenic analysis for cell proliferation in Calu-6 and rpL3ΔCalu-6 cells after Act D treatment. Bar chart indicating clonogenic growth is shown. (B) Role of rpL3 on apoptosis upon Act D treatment. Calu-6 and rpL3ΔCalu-6 were treated with 5 nM of Act D for 24 h or untreated. Then, cells were analyzed for mitochondrial membrane potential by TMRE staining and analyzed by flow cytometry. (C) Role of rpL3 on cell viability upon Act D treatment. Cell viability of untreated or Act D treated Calu-6 cells and Calu-6 cells transiently transfected with pHA-rpL3 was evaluated using the MTT assay. The cell viability was calculated vs untreated control cells at the respective time of incubation, set as 100%. Results are presented as percentage (mean ± ds) (n = 3) of the control cells.
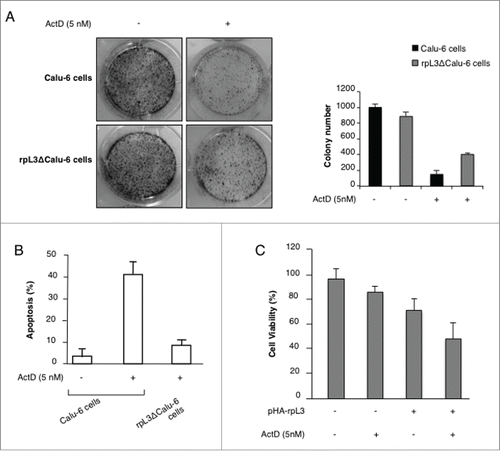
Figure 6. Role of rpL3 on cell migration upon Act D treatment. Calu-6 cells untransfected or transiently transfected with pHa-rpL3 were treated with 5 nM of Act D for 24 h. Wound widths were measured at 0, 8 and 24 h on 3 fields per well and averaged. Data is expressed as the fold-decrease of area respect to controls (A,D,G) set as 100%. Bars represent the mean of triplicate experiments; error bars represent the standard deviation.
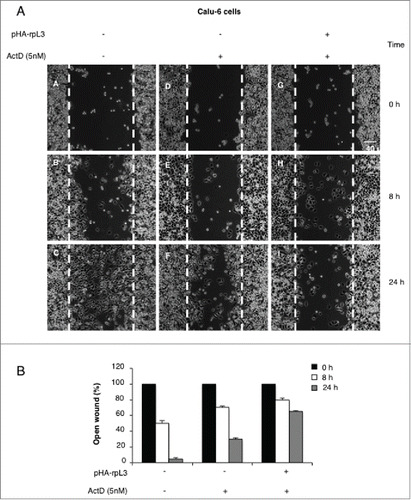
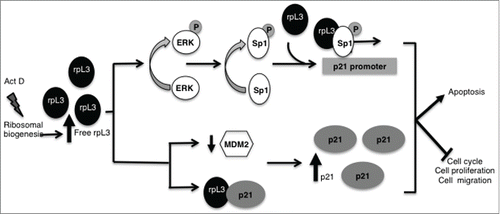
Figure 7. Schematic representation of proposed model. Act D induced nucleolar stress caused an induction of rpL3 total intracellular levels and the accumulation of rpL3 as ribosome-free form. Free rpL3 becomes a regulator of p21 expression. At transcrptional level, rpL3 induces the phosphorylation of ERK that, in turn, could promote the phosphorylation of Sp1. Then, rpL3 could recruit phosphorylated Sp1 and induce the transactivation of p21 promoter. At post-translational level, rpL3 binds and stabilizes p21 protein and downregulates MDM2. rpL3 effects associate to cell cycle arrest, apoptosis and inhibition of cell proliferation and migration.