1,647
Views
23
CrossRef citations to date
0
Altmetric
Report

G1 checkpoint is compromised in mouse ESCs due to functional uncoupling of p53-p21Waf1 signaling

, , , &
Pages 52-63 | Received 14 Aug 2015, Accepted 12 Nov 2015, Published online: 15 Jan 2016

Figures & data

Figure 1. Gamma-irradiation induces p53 Ser15 phosphorylation and nuclear accumulation. (A) Immunofluorescent staining of mESCs with antibody to phospho-p53 (Ser15) 2 h post-irradiation (6 Gy) (green). Nuclei were stained with To-Pro3 (blue). Scale bar 10 μM. (B) Western blotting analysis of protein extracts from non-irradiated and irradiated mESCs. Blots were stained 2, 4 and 8 h post-irradiation (6 Gy) using antibody to phospho-p53 (Ser15), acetyl-p53 (Lys 379) and total p53. (C) A luciferase assay of control and irradiated mESCs after transient transfection with luciferase reporter plasmid PG13-Luc. At time points 4 and 24 h post-irradiation cells were subjected to luciferase activity assays. Pifithrin-α, an inhibitor p53-transcriptional activity (10 μM), was added to the 4 h reaction as a negative control. Error bars correspond to SEM calculated for 3 replicates. (D) Western blotting analysis of control, transfected with luciferase reporter plasmid PG13-Luc and irradiated with 3 Gy (4 h post-irradiation) mESCs. Irradiated cells were taken as control. Blots were stained using antibody to phospho-histone H2AX (Ser139) (γH2AX), phospho-p53 (Ser15) and total p53.
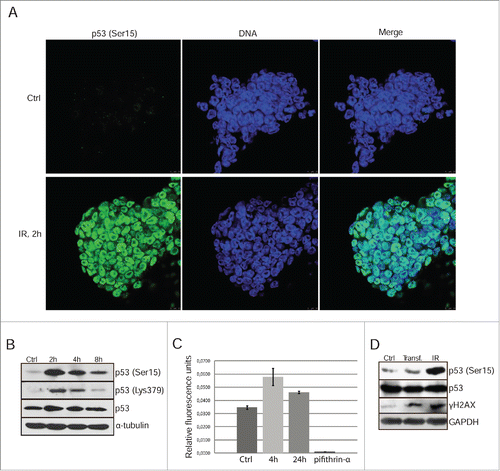
Figure 1. Gamma-irradiation induces p53 Ser15 phosphorylation and nuclear accumulation. (A) Immunofluorescent staining of mESCs with antibody to phospho-p53 (Ser15) 2 h post-irradiation (6 Gy) (green). Nuclei were stained with To-Pro3 (blue). Scale bar 10 μM. (B) Western blotting analysis of protein extracts from non-irradiated and irradiated mESCs. Blots were stained 2, 4 and 8 h post-irradiation (6 Gy) using antibody to phospho-p53 (Ser15), acetyl-p53 (Lys 379) and total p53. (C) A luciferase assay of control and irradiated mESCs after transient transfection with luciferase reporter plasmid PG13-Luc. At time points 4 and 24 h post-irradiation cells were subjected to luciferase activity assays. Pifithrin-α, an inhibitor p53-transcriptional activity (10 μM), was added to the 4 h reaction as a negative control. Error bars correspond to SEM calculated for 3 replicates. (D) Western blotting analysis of control, transfected with luciferase reporter plasmid PG13-Luc and irradiated with 3 Gy (4 h post-irradiation) mESCs. Irradiated cells were taken as control. Blots were stained using antibody to phospho-histone H2AX (Ser139) (γH2AX), phospho-p53 (Ser15) and total p53.

Figure 2. Negative control of p21Waf1 expression occurs at 2 levels of regulation: epigenetic modulation of gene transcription and proteasome-mediated protein degradation. (A) RT-PCR analysis of p21/Waf1 gene transcripts 6 h post-irradiation of mESCs. Gapdh was used as an internal control (left panel). Western blotting analysis of protein extracts from control and irradiated mESCs (8 and 20 h post-irradiation) using antibodies against p21/Waf1 protein. NIH3T3 cells were taken as control (right panel). (B) mESCs were treated with lactacystin (10 μM) and MG132 (10 μM) for 4 h, then extracted proteins were subjected to immunoblotting with antibody to p21/Waf1 protein (left panel). FACS analysis of cell cycle distribution of mESCs treated with lactacystin (Lc) (10 μM) for 20 h (right panel). (C) FACS analysis of cell cycle distribution of untreated mESCs and treated with NaBut (4 mM for 24 h) (left 2 panels). RT-PCR assay for p21/Waf1 transcription in mESCs treated with NaBut (4 mM); gapdh was used as an internal control (middle panel). Western blotting analysis of lysates from untreated (Ctrl) and NaBut-treated mESCs (4 mM for 24 h) using antibodies against p21/Waf1 (right panel). (D) Western blotting analysis of protein extracts from control (Ctrl), treated with NaBut (4 mM, 24 h), and irradiated (2 h, 6 Gy) cells (left panel). Blots were stained using antibody to phospho-p53 (Ser15) and total p53. In the middle panel, RT-PCR analysis of mRNA transcripts of oct3/4, nanog, sox2, afp, and gata6 genes in mESCs treated with 4 mM NaBut for 24 h; gapdh was used as an internal control (middle panel). In the right panel, mESCs treated with 4 mM NaBut for 24 h were analyzed by western blot for Oct3/4, Nanog and Sox2 proteins (right panel).
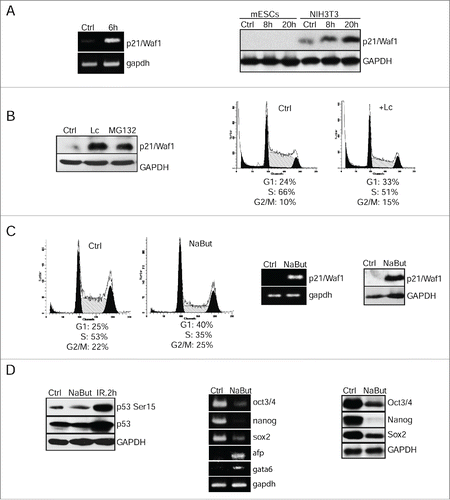
Figure 2. Negative control of p21Waf1 expression occurs at 2 levels of regulation: epigenetic modulation of gene transcription and proteasome-mediated protein degradation. (A) RT-PCR analysis of p21/Waf1 gene transcripts 6 h post-irradiation of mESCs. Gapdh was used as an internal control (left panel). Western blotting analysis of protein extracts from control and irradiated mESCs (8 and 20 h post-irradiation) using antibodies against p21/Waf1 protein. NIH3T3 cells were taken as control (right panel). (B) mESCs were treated with lactacystin (10 μM) and MG132 (10 μM) for 4 h, then extracted proteins were subjected to immunoblotting with antibody to p21/Waf1 protein (left panel). FACS analysis of cell cycle distribution of mESCs treated with lactacystin (Lc) (10 μM) for 20 h (right panel). (C) FACS analysis of cell cycle distribution of untreated mESCs and treated with NaBut (4 mM for 24 h) (left 2 panels). RT-PCR assay for p21/Waf1 transcription in mESCs treated with NaBut (4 mM); gapdh was used as an internal control (middle panel). Western blotting analysis of lysates from untreated (Ctrl) and NaBut-treated mESCs (4 mM for 24 h) using antibodies against p21/Waf1 (right panel). (D) Western blotting analysis of protein extracts from control (Ctrl), treated with NaBut (4 mM, 24 h), and irradiated (2 h, 6 Gy) cells (left panel). Blots were stained using antibody to phospho-p53 (Ser15) and total p53. In the middle panel, RT-PCR analysis of mRNA transcripts of oct3/4, nanog, sox2, afp, and gata6 genes in mESCs treated with 4 mM NaBut for 24 h; gapdh was used as an internal control (middle panel). In the right panel, mESCs treated with 4 mM NaBut for 24 h were analyzed by western blot for Oct3/4, Nanog and Sox2 proteins (right panel).

Figure 3. Restoration of G1 checkpoint due to accumulation of p21/Waf1 in irradiated mESCs is accompanied by loss of pluripotency. (A) Western blotting analysis of protein extracts from unirradiated and irradiated mESCs. Blots were stained at 1 and 3 d 3 Gy post-irradiation using antibody to phospho-p53 (Ser15) and total p53 (left panel). The mRNA levels of p21/Waf1 gene was determined by qRT-PCR and standardized by the mRNA levels of gapdh. Data are presented as mean ±SEM, n = 3 (middle panel). Cell lysates from mESCs in the indicated time points were analyzed by Western blotting using antibodies against p21/Waf1 protein (right panel). (B) FACS analysis of cell cycle distribution of unirradiated mESCs and irradiated with 3 Gy. Cells were harvested at 1 and 3 d after irradiation. (C) The mRNA levels of oct3/4, nanog and sox2 genes were determined by qRT-PCR and standardized by the mRNA levels of gapdh. Data are presented as mean ±SEM, n = 3. (D) Western blotting analysis of protein extracts from non-irradiated and irradiated mESCs. Blots were stained 1, 3, 5 d post-irradiation (3 Gy) using antibody to Oct3/4, Nanog and Sox2. A relative densitometry analysis of the Oct3/4, Nanog, Sox2 protein expression (normalized to α-tubulin) was performed using Gel-Pro Analyzer software.
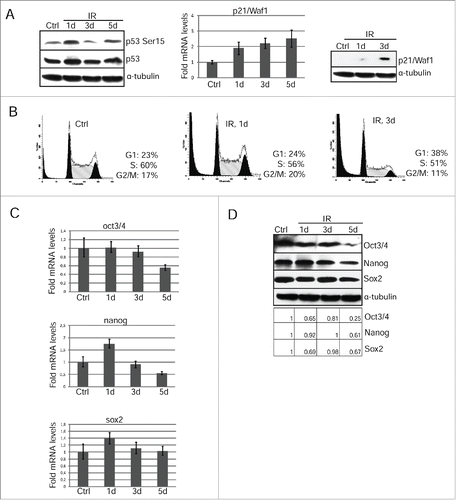
Figure 3. Restoration of G1 checkpoint due to accumulation of p21/Waf1 in irradiated mESCs is accompanied by loss of pluripotency. (A) Western blotting analysis of protein extracts from unirradiated and irradiated mESCs. Blots were stained at 1 and 3 d 3 Gy post-irradiation using antibody to phospho-p53 (Ser15) and total p53 (left panel). The mRNA levels of p21/Waf1 gene was determined by qRT-PCR and standardized by the mRNA levels of gapdh. Data are presented as mean ±SEM, n = 3 (middle panel). Cell lysates from mESCs in the indicated time points were analyzed by Western blotting using antibodies against p21/Waf1 protein (right panel). (B) FACS analysis of cell cycle distribution of unirradiated mESCs and irradiated with 3 Gy. Cells were harvested at 1 and 3 d after irradiation. (C) The mRNA levels of oct3/4, nanog and sox2 genes were determined by qRT-PCR and standardized by the mRNA levels of gapdh. Data are presented as mean ±SEM, n = 3. (D) Western blotting analysis of protein extracts from non-irradiated and irradiated mESCs. Blots were stained 1, 3, 5 d post-irradiation (3 Gy) using antibody to Oct3/4, Nanog and Sox2. A relative densitometry analysis of the Oct3/4, Nanog, Sox2 protein expression (normalized to α-tubulin) was performed using Gel-Pro Analyzer software.

Figure 4. IR-induced mESCs activate expression of differentiation markers. (A) RT-PCR analysis of afp and sox17 genes transcription in non-irradiated mESCs and 1, 3, 5 d post-irradiation (3 Gy). gapdh was used as an internal control. (B) Representative images of colonies of non-irradiated and irradiated (3 Gy) mESCs. Cells were examined at 5 d after irradiation using light microscope. (C) Immunofluorescent staining of mESCs with antibody to a surface marker SSEA-1 5 d post-irradiation (3 Gy) (red). Nuclei were stained with DAPI (blue). Scale bar 75 μM.
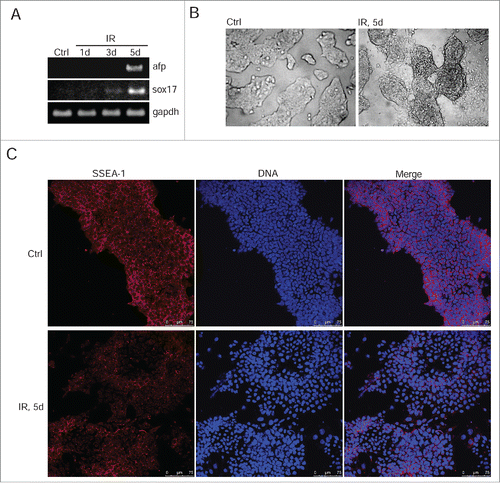
Figure 4. IR-induced mESCs activate expression of differentiation markers. (A) RT-PCR analysis of afp and sox17 genes transcription in non-irradiated mESCs and 1, 3, 5 d post-irradiation (3 Gy). gapdh was used as an internal control. (B) Representative images of colonies of non-irradiated and irradiated (3 Gy) mESCs. Cells were examined at 5 d after irradiation using light microscope. (C) Immunofluorescent staining of mESCs with antibody to a surface marker SSEA-1 5 d post-irradiation (3 Gy) (red). Nuclei were stained with DAPI (blue). Scale bar 75 μM.

Figure 5. Nutlin-dependent p53 activation is accompanied by loss of mESCs pluripotency. (A) Lysates prepared from mESCs treated with nutlin (10 μM) for 1 and 3 d were analyzed by Western blotting with antibodies specific to p53-Ser15 and total p53 (left panel). The mRNA level of p21/Waf1 gene wase determined by qRT-PCR and standardized by the mRNA levels of gapdh. Data are presented as mean ±SEM, n=3 (middle panel). Western blot analysis of protein extracts from untreated and treated with nutlin mESCs using antibodies against p21/Waf1 protein at the same time point (right panel). (B) Cell cycle parameters of mESCs untreated and treated with nutlin (10 μM) for 1 and 3 d. (C) RNA transcripts from mESCs treated with nutlin (10 μM) for 1, 3 and 5 d were subjected to qRT-PCR assay using primers specific for mouse oct3/4, nanog and sox2. Results of qRT-PCR are displayed as the mean ± SEM, n=3. (D) Lysates prepared from mESCs treated with nutlin (10 μM) for 1, 3 and 5 d were analyzed by Western blotting with antibodies specific for Oct3/4, Nanog and Sox2. A relative densitometry analysis of the Oct3/4, Nanog, Sox2 protein expression (normalized to α-tubulin) was performed using Gel-Pro Analyzer software.
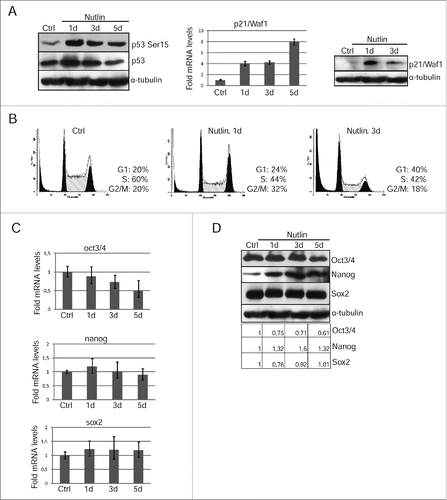
Figure 5. Nutlin-dependent p53 activation is accompanied by loss of mESCs pluripotency. (A) Lysates prepared from mESCs treated with nutlin (10 μM) for 1 and 3 d were analyzed by Western blotting with antibodies specific to p53-Ser15 and total p53 (left panel). The mRNA level of p21/Waf1 gene wase determined by qRT-PCR and standardized by the mRNA levels of gapdh. Data are presented as mean ±SEM, n=3 (middle panel). Western blot analysis of protein extracts from untreated and treated with nutlin mESCs using antibodies against p21/Waf1 protein at the same time point (right panel). (B) Cell cycle parameters of mESCs untreated and treated with nutlin (10 μM) for 1 and 3 d. (C) RNA transcripts from mESCs treated with nutlin (10 μM) for 1, 3 and 5 d were subjected to qRT-PCR assay using primers specific for mouse oct3/4, nanog and sox2. Results of qRT-PCR are displayed as the mean ± SEM, n=3. (D) Lysates prepared from mESCs treated with nutlin (10 μM) for 1, 3 and 5 d were analyzed by Western blotting with antibodies specific for Oct3/4, Nanog and Sox2. A relative densitometry analysis of the Oct3/4, Nanog, Sox2 protein expression (normalized to α-tubulin) was performed using Gel-Pro Analyzer software.

Figure 6. Nutlin-dependent activation of p53 induces differentiation of mESCs. (A) RT-PCR analysis of sox17, gata6 and afp RNA transcripts in mESCs untreated and treated with nutlin (10 μM) for 1, 3 and 5 days, gapdh was used as an internal control. (B) Representative images of mESCs colonies untreated and treated with nutlin (10 μM) for 5 d. Cells were examined using light microscope. (C) Immunofluorescent staining of mESCs with antibody to surface-specific marker SSEA-1 (red) after 5 d of nutlin treatment (10 μM). Nuclei were stained with DAPI (blue). Scale bar 75 μM.
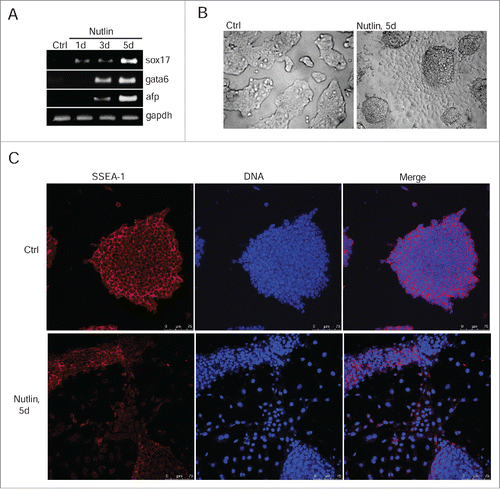
Figure 6. Nutlin-dependent activation of p53 induces differentiation of mESCs. (A) RT-PCR analysis of sox17, gata6 and afp RNA transcripts in mESCs untreated and treated with nutlin (10 μM) for 1, 3 and 5 days, gapdh was used as an internal control. (B) Representative images of mESCs colonies untreated and treated with nutlin (10 μM) for 5 d. Cells were examined using light microscope. (C) Immunofluorescent staining of mESCs with antibody to surface-specific marker SSEA-1 (red) after 5 d of nutlin treatment (10 μM). Nuclei were stained with DAPI (blue). Scale bar 75 μM.
Supplemental material

Supplementary_figures_1-3.pptx

Download MS Power Point (137.5 KB)

Reprints and Corporate Permissions

Please note: Selecting permissions does not provide access to the full text of the article, please see our help page How do I view content?

To request a reprint or corporate permissions for this article, please click on the relevant link below:

Academic Permissions

Please note: Selecting permissions does not provide access to the full text of the article, please see our help page How do I view content?

Obtain permissions instantly via Rightslink by clicking on the button below:

If you are unable to obtain permissions via Rightslink, please complete and submit this Permissions form. For more information, please visit our Permissions help page.