2,344
Views
36
CrossRef citations to date
0
Altmetric
Report

Mitochondrial dysfunction induces SESN2 gene expression through Activating Transcription Factor 4

, , &
Pages 64-71 | Received 19 Aug 2015, Accepted 12 Nov 2015, Published online: 15 Jan 2016

Figures & data

Table 1. Fold change in mRNA levels of HCT116 cells treated with 1μM myxothiazol for 5 h (M5), 13h (M13), 17h (M17) or with 1μM myxothiazol and 1 mM uridine for 13 h (MU13). The data was obtained by RNA-seq;29 FDR <0.05.

Figure 1. Induction of SESN2 mRNA in response to the inhibition of the mitochondrial respiratory chain is independent of p53. (A, B) Fold changes of SESN2 mRNA (A) and of the p53-target gene TP53INP1 mRNA (B) in wild-type or p53-/- HCT116 cells after myxothiazol (4 h) and/or nutlin-3 (16 h) treatment. (C, D) Fold changes of SESN2 (C) and TP53INP1 (D) mRNAs in HCT116 cells treated with piericidin A (4 h). The data was obtained by RT-qPCR, the normalization was to 18S rRNA. The means and standard deviations on the basis of at least 3 independent experiments are presented. Student's t-test was used to analyze statistical significance (*P < 0.05, **P<0.01, ***P< 0.001).
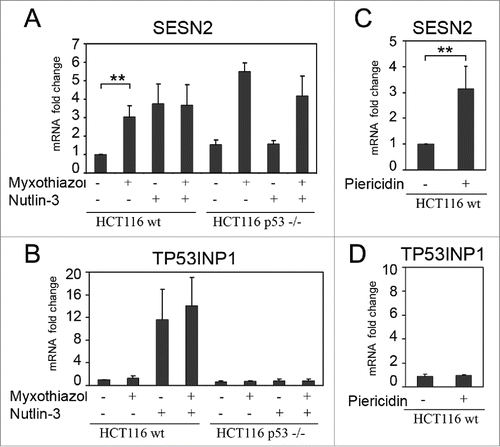
Figure 1. Induction of SESN2 mRNA in response to the inhibition of the mitochondrial respiratory chain is independent of p53. (A, B) Fold changes of SESN2 mRNA (A) and of the p53-target gene TP53INP1 mRNA (B) in wild-type or p53-/- HCT116 cells after myxothiazol (4 h) and/or nutlin-3 (16 h) treatment. (C, D) Fold changes of SESN2 (C) and TP53INP1 (D) mRNAs in HCT116 cells treated with piericidin A (4 h). The data was obtained by RT-qPCR, the normalization was to 18S rRNA. The means and standard deviations on the basis of at least 3 independent experiments are presented. Student's t-test was used to analyze statistical significance (*P < 0.05, **P<0.01, ***P< 0.001).
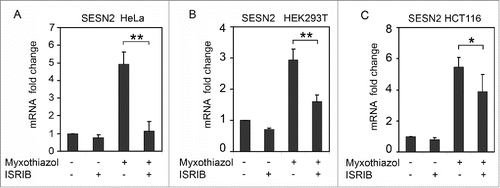
Figure 2. Induction of SESN2 mRNA in response to the inhibition of mitochondrial respiratory chain depends on ISR. SESN2 mRNA level in HeLa (A), HEK293T (B) and HCT116 (C) cells after treatment with 1μM myxothiazol, with and without 200 nM ISRIB (4h). The data was obtained by RT-qPCR, normalized to18S rRNA. The means and standard deviations on the basis of at least 3 independent experiments are presented. Student's t-test was used to analyze statistical significance (*P < 0.05, **P<0.01, ***P< 0.001).

Figure 2. Induction of SESN2 mRNA in response to the inhibition of mitochondrial respiratory chain depends on ISR. SESN2 mRNA level in HeLa (A), HEK293T (B) and HCT116 (C) cells after treatment with 1μM myxothiazol, with and without 200 nM ISRIB (4h). The data was obtained by RT-qPCR, normalized to18S rRNA. The means and standard deviations on the basis of at least 3 independent experiments are presented. Student's t-test was used to analyze statistical significance (*P < 0.05, **P<0.01, ***P< 0.001).

Figure 3. The effect of ATF4 knockdown on SESN2 mRNA expression. ATF4 (A, C) and SESN2 (B, D) mRNA fold changes in HeLa (A, B) and RKO (C, D) cells expressing ATF4 shRNA (ATF4) or a scrambled control shRNA (sc). The cells were treated with 1 μM myxothiazol for 4 h where indicated. The data was obtained by RT-qPCR and normalized to 18S rRNA. The means and standard deviations on the basis of 3 independent experiments are presented. Student's t-test was used to analyze statistical significance (*P < 0.05, **P < 0.01, ***P < 0.001).
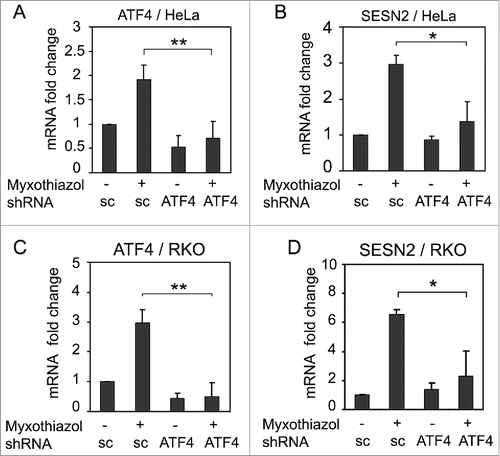
Figure 3. The effect of ATF4 knockdown on SESN2 mRNA expression. ATF4 (A, C) and SESN2 (B, D) mRNA fold changes in HeLa (A, B) and RKO (C, D) cells expressing ATF4 shRNA (ATF4) or a scrambled control shRNA (sc). The cells were treated with 1 μM myxothiazol for 4 h where indicated. The data was obtained by RT-qPCR and normalized to 18S rRNA. The means and standard deviations on the basis of 3 independent experiments are presented. Student's t-test was used to analyze statistical significance (*P < 0.05, **P < 0.01, ***P < 0.001).

Figure 4. The effect of ATF4 overexpression on SESN2 mRNA levels. ATF4 (A, B) and SESN2 (C, D) mRNA fold changes in HCT116 (A, C) and HeLa (B, D) cells with ectopic expression of ATF4 mRNA (ATF4) or transfected with a control empty vector (Control). The data was obtained by RT-qPCR and normalized to 18S rRNA. The means and standard deviations on the basis of 3 independent experiments are presented. Student's t-test was used to analyze statistical significance (*P < 0.05, **P<0.01, ***P< 0.001).
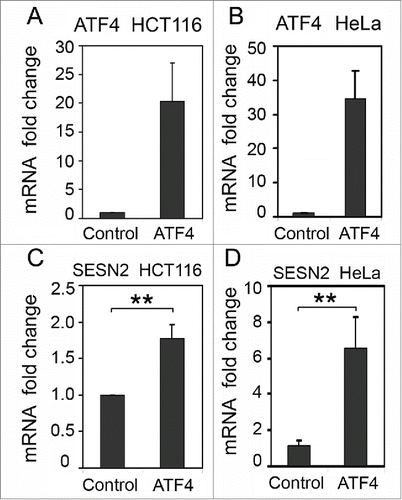
Figure 4. The effect of ATF4 overexpression on SESN2 mRNA levels. ATF4 (A, B) and SESN2 (C, D) mRNA fold changes in HCT116 (A, C) and HeLa (B, D) cells with ectopic expression of ATF4 mRNA (ATF4) or transfected with a control empty vector (Control). The data was obtained by RT-qPCR and normalized to 18S rRNA. The means and standard deviations on the basis of 3 independent experiments are presented. Student's t-test was used to analyze statistical significance (*P < 0.05, **P<0.01, ***P< 0.001).

Figure 5. Overexpression of ATF4 (but not p53) stimulates the luciferase reporter controlled by the SESN2 gene promoter region. (A) The reporter constructions. (B) Stimulation of luciferase reporter by ATF4 expression in HCT116 cells compared to the control HCT116 cells transfected with the empty vector. (C) The activity of reporters pGL3-SESN2 or pGL3-SESN2_mut with a mutated putative ATF4 binding site in HeLa cells with ectopic expression of p53 or ATF4 compared to control cells transfected with an empty vector. The effects of ATF4 and p53 expression are presented as relative values in comparison to normalized reporter activities in control cells. The means and standard deviations on the basis of at least 3 independent experiments are presented. Student's t-test was used to analyze statistical significance (*P < 0.05, **P < 0.01, ***P < 0.001).
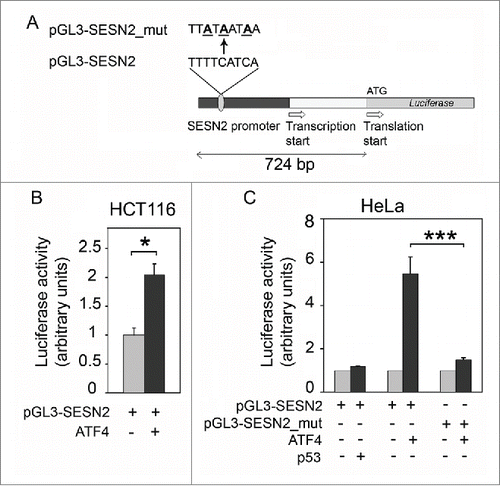
Figure 5. Overexpression of ATF4 (but not p53) stimulates the luciferase reporter controlled by the SESN2 gene promoter region. (A) The reporter constructions. (B) Stimulation of luciferase reporter by ATF4 expression in HCT116 cells compared to the control HCT116 cells transfected with the empty vector. (C) The activity of reporters pGL3-SESN2 or pGL3-SESN2_mut with a mutated putative ATF4 binding site in HeLa cells with ectopic expression of p53 or ATF4 compared to control cells transfected with an empty vector. The effects of ATF4 and p53 expression are presented as relative values in comparison to normalized reporter activities in control cells. The means and standard deviations on the basis of at least 3 independent experiments are presented. Student's t-test was used to analyze statistical significance (*P < 0.05, **P < 0.01, ***P < 0.001).

Reprints and Corporate Permissions

Please note: Selecting permissions does not provide access to the full text of the article, please see our help page How do I view content?

To request a reprint or corporate permissions for this article, please click on the relevant link below:

Academic Permissions

Please note: Selecting permissions does not provide access to the full text of the article, please see our help page How do I view content?

Obtain permissions instantly via Rightslink by clicking on the button below:

If you are unable to obtain permissions via Rightslink, please complete and submit this Permissions form. For more information, please visit our Permissions help page.