Figures & data
Figure 1. CAPNS1 depletion alters breast cancer cells growth on plate and in soft agar. Control and CAPNS1 depleted MCF7 cells (1A) or MCF10AT (1B) were plated on 6 cm dishes at the indicated concentration. Two weeks later, the cells were stained with crystal violet and images were acquired by Epson scanner. Images of representative experiments are shown. Colonies were counted using image J software; the graph reports the average of 3 independent experiments (p values <0.01). Control and CAPNS1 depleted MCF7 cells (1C) or MCF10AT (1D) were resuspended in 0.3 % agar and the indicated number of cells was plated on 1% agar according to standard procedures. Three weeks later colonies were counted. The graphs report the average number of colonies counted in 3 independent experiments (p values <0.01). Representative pictures are shown next to the graphs.
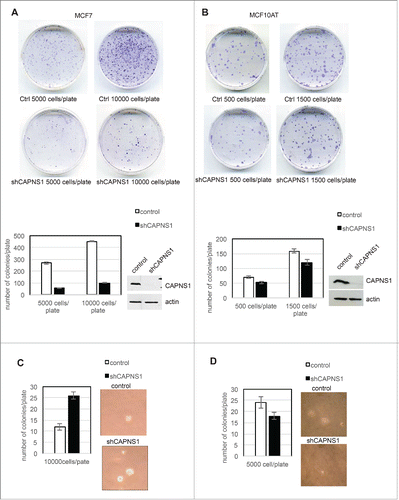
Figure 2. CAPNS1 depletion does not affect mammary acini number, but is involved in mammary acini growth and architecture. (A) Representative bright field pictures of control (left panel) and shCAPNS1 (right panel) MCF10A cells grown in 3D. Scale bar corresponds to 50 μm. (B) Average number of acini counted in 3 independent experiments (p value = 0.2). (C) Percentage of acini of different dimensions as indicated. The graph represent mean values obtained in 3 independent experiments (p values <0.01). (D) Representative immunofluorescence pictures of control (upper panels) and shCAPNS1 (lower panels) MCF10A cells grown in 3D, stained with the indicated antibodies. Scale bar corresponds to 50 μm. (E) Mouse embryonic stem cells were silenced with control siRNA or CAPNS1 specific siRNA and grown in differentiation media. The graph indicates the quantification of mRNA expression of the indicated transcripts by real time PCR analysis (p values <0.01).
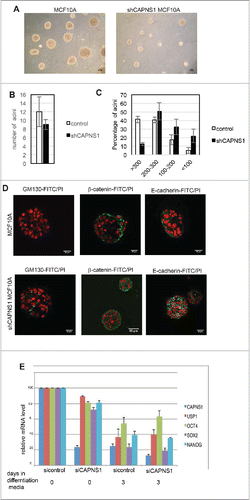
Figure 3. Calpain affects mammosphere forming efficiency. Control and CAPNS1 depleted MCF7 and MCF10AT cells were plated in 96 wells multiwell plates (1000 cells/well) in mammosphere specific medium. After ten days, the mammospheres were collected and disaggregated. Mammospheres derived cells were counted and plated as for the first generation and 7 d later picture were taken. (A) typical MCF7 mammospheres. Scale bar corresponds to 50 μm. (B) reports the average number of second generation MCF7 mammospheres obtained in 3 independent experiments (p values <0.01). (C) typical MCF10AT mammospheres. Scale bar corresponds to 50 μm. (D) reports the average number of second generation MCF10AT mammospheres obtained in 3 independent experiments (p values <0.01). (E) shows the average number of mammospheres counted in 3 independent experiments in control and shCAPNS1 MCF10AT treated or not treated with thapsigargin (p values<005). Briefly, control and CAPNS1 depleted MCF10AT cells were plated on 96 wells multiwells (1000 cells/well) in mammosphere specific medium. After 7 days, the mammospheres were incubated or not with 100 nM thapsigargin for 6 hours. Mammospheres derived cells were counted and plated as for the first generation and 7 d later the number of second generation mammospheres was counted. Control and CAPNS1 depleted MCF10AT cells derived from second generation mammospheres were stained with anti CD44 and anti CD24 antibodies and analyzed by FACS. Adherent cells were analyzed in parallel. The dot plot (F) and the graph (G) are the results of a typical FACS analysis.
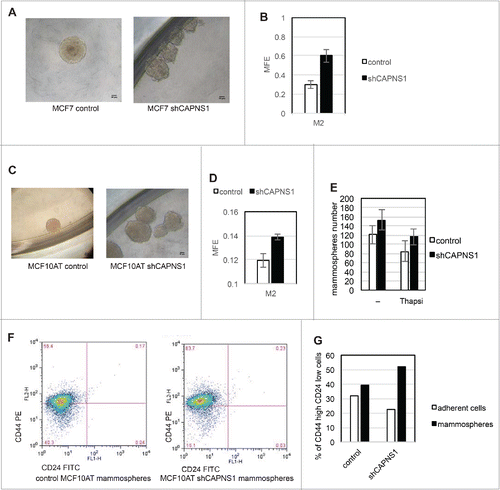
Figure 4. CAPNS1 depletion is coupled to breast cancer stem cells expansion.CD44+/CD24- population was sorted by FACS analysis from CAPNS1 depleted and control MCF10AT cells. Nuclear and cytoplasmic extracts obtained from sorted cells and analyzed by western blot with the indicated antibodies (A). In parallel, sorted CD44+/CD24- cells were utilized for mammosphere formation assay. (B) reports the average mammosphere forming efficiency for the first (M1) and second generation (M2) (p values <005). (C) reports the average MFE of second generation mammospheres with diameter larger than 250 micrometres (p values <005). (D, E) Control and shCAPNS1 MCF10AT were stained with PHK26 vital dye and after extensive washing were plated in mammosphere forming medium. Pictures were taken after 2 weeks. Scale bar corresponds to 50 μm. The percentage of PKH26 stained area of 4 planes of 4 control and 4 shCAPNS1 mammospheres was measured by Image J and is reported in the graph. (F) CAPNS1 depleted and control adherent MCF10AT cells and cells derived from first and second generation mammospheres derived from the same cells were lysed and analyzed by western blot with the indicated antibodies.
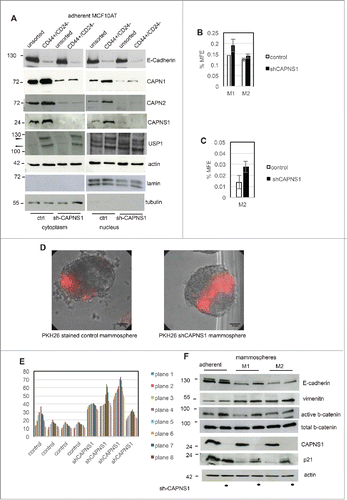
Figure 5. CAPNS1 depletion is linked to expansion of PKH26 stained cells that can be rescued upon CAPNS1 reintroduction. (A) CAPNS1 expression in MCF10AT cell lines: control MCF10AT, shCAPNS1 MCF10AT, shCAPNS1 MCF10AT stably expressing siRNA resistant CAPNS1. (B) Average number of mammosphere number obtained in 3 independent experiments with MCF10AT derived cell lines described above (p values <005). (C) Average of PKH26 stained cells in mammospheres obtained in 3 independent experiments (p values <005). (D) Subsequent pictures taken 3, 5, 7, 9 d after seeding of representative mammosphere obtained from the above described cell lines. Scale bar corresponds to 50 μm.
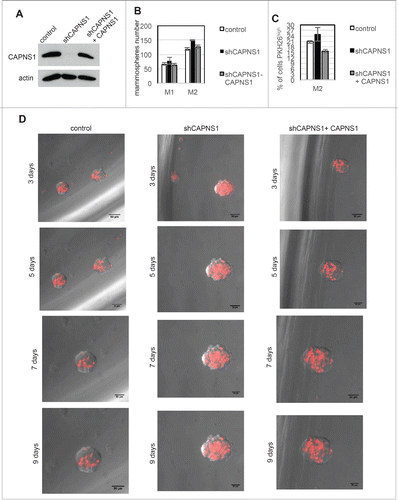
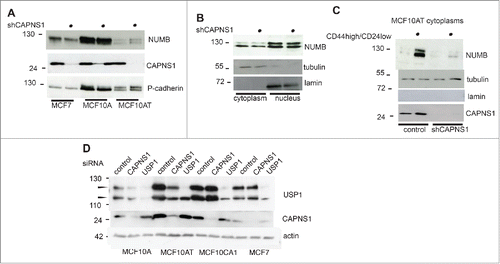
Figure 6. CAPNS1 depletion is coupled to a decrease in NUMB protein level.NUMB protein level was compared by western blot in CAPNS1 depleted versus control cells, using total cell lysates of MCF7, MCF10A and MCF10AT cells (A) nuclear and cytoplasmic extracts of MCF10AT cells (B) and cytoplasms from CD44 high/CD24 low sorted MCF10AT cells (C). (D) CAPNS1 specific, USP1 specific or a control siRNA were transfected in the indicated cell lines. 48 hours later, lysates were analyzed by western blot to monitor USP1 and CAPNS1 levels. Actin was used as loading control.