1,420
Views
12
CrossRef citations to date
0
Altmetric
Report

Tetraploid cells produced by absence of substrate adhesion during cytokinesis are limited in their proliferation and enter senescence after DNA replication

, , , &
Pages 274-282 | Received 03 Apr 2015, Accepted 27 Nov 2015, Published online: 29 Jan 2016

Figures & data

Figure 1. Cytokinesis in suspension produces binucleated cells. (A) Experimental schedule. (B) Frequency of binucleated cells in MRC-5 cultures grown in adherence with or without a 3hr NOC treatment (Adherence) or after mitotic shake off and cytokinesis in suspension (Shake off) with or without a 3hr NOC pre-treatment (see experimental schedule). Binucleated cells were identified by actin and tubulin staining. DNA was counterstained by DAPI. Results shown are the mean ± SEM of 4 independent experiments. **P <0.01 (Student's t-test, vs. untreated). (C) Frequencies of the different mitotic stages after detachment from the substrate with or without a 3hr NOC pre-treatment. The different mitotic stages are depicted in the images. PM: prometaphase, M: metaphase, A: anaphase, T: telophase. Results shown are the mean ± SEM of 4 independent experiments. Scale bar = 5 μm.
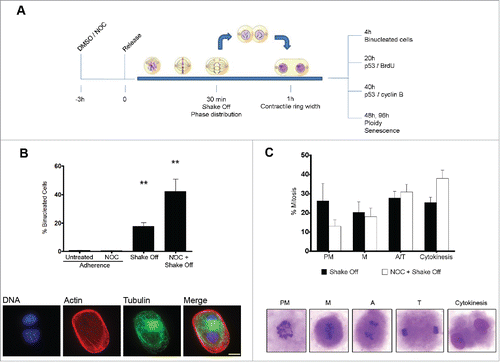
Figure 1. Cytokinesis in suspension produces binucleated cells. (A) Experimental schedule. (B) Frequency of binucleated cells in MRC-5 cultures grown in adherence with or without a 3hr NOC treatment (Adherence) or after mitotic shake off and cytokinesis in suspension (Shake off) with or without a 3hr NOC pre-treatment (see experimental schedule). Binucleated cells were identified by actin and tubulin staining. DNA was counterstained by DAPI. Results shown are the mean ± SEM of 4 independent experiments. **P <0.01 (Student's t-test, vs. untreated). (C) Frequencies of the different mitotic stages after detachment from the substrate with or without a 3hr NOC pre-treatment. The different mitotic stages are depicted in the images. PM: prometaphase, M: metaphase, A: anaphase, T: telophase. Results shown are the mean ± SEM of 4 independent experiments. Scale bar = 5 μm.

Figure 2. Cytokinesis in suspension produces defective cleavage furrow constriction. (A) Representative images of late telophase cells grown in adherence or cytospun on slides after mitotic shake off and cytokinesis in suspension. Scale bar = 5 μm. (B) Contractile ring width in late telophase cells grown on adherence (Adherence), after cytokinesis in suspension (Shake off) or after cytokinesis in suspension with a 3hr NOC pre-treatment (NOC + Shake off). Late telophase cells were identified by the presence of decondensed chromatin and of a midbody following α tubulin and DNA staining; contractile ring width was measured on phase contrast images. Ten to twenty cells were measured for each condition. **P <0.01 (Student's t-test, vs. adherence).
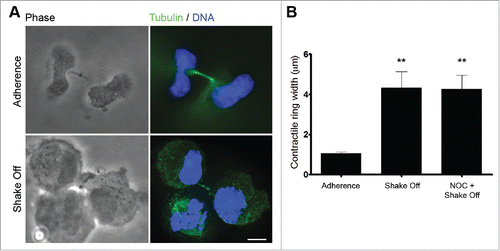
Figure 2. Cytokinesis in suspension produces defective cleavage furrow constriction. (A) Representative images of late telophase cells grown in adherence or cytospun on slides after mitotic shake off and cytokinesis in suspension. Scale bar = 5 μm. (B) Contractile ring width in late telophase cells grown on adherence (Adherence), after cytokinesis in suspension (Shake off) or after cytokinesis in suspension with a 3hr NOC pre-treatment (NOC + Shake off). Late telophase cells were identified by the presence of decondensed chromatin and of a midbody following α tubulin and DNA staining; contractile ring width was measured on phase contrast images. Ten to twenty cells were measured for each condition. **P <0.01 (Student's t-test, vs. adherence).

Figure 3. Binucleated cells induced by cytokinesis in suspension progress through S phase. (A) Representative images of BrdU incorporation in mononucleated cells grown in adherence or in binucleated cells obtained 20 hrs after cytokinesis in suspension. (B) Frequency of BrdU-positive cells among mononucleated cells grown in adherence and mononucleated or binucleated cells obtained 20 hrs after cytokinesis in suspension (Shake off) or after cytokinesis in suspension with a 3 hr NOC pre-treatment (NOC + Shake off). Results shown are the mean ± SEM of 3 independent experiments. For each experiment at least 200 mononucleated cells were analyzed in adherence condition, 200 mononucleated and 50 binucleated cells after cytokinesis in suspension. (C) Representative images of p53 immunostaining in cells grown in adherence (Adherence), after camptothecin treatment (CPT), or in binucleated cells obtained 20 hrs after cytokinesis in suspension (Shake off). Binucleation was confirmed by actin immunostaining. (D) Frequency of p53-positive cells in cells grown in adherence (untreated), after camptothecin treatment (CPT) or nocodazole exposure (NOC) in adherence, and in mononucleated or binucleated cells obtained 20 hrs after cytokinesis in suspension (Shake off) or after cytokinesis in suspension with a 3hr NOC pre-treatment (NOC + Shake off). Results shown are the mean ± SEM of 3 independent experiments. For each experiment at least 500 mononucleated cells were analyzed in adherence conditions, 200 mononucleated and 50 binucleated cells after cytokinesis in suspension. *P<0.05; **P<0.01 (Student's t-test). Scale bar = 5 μm.
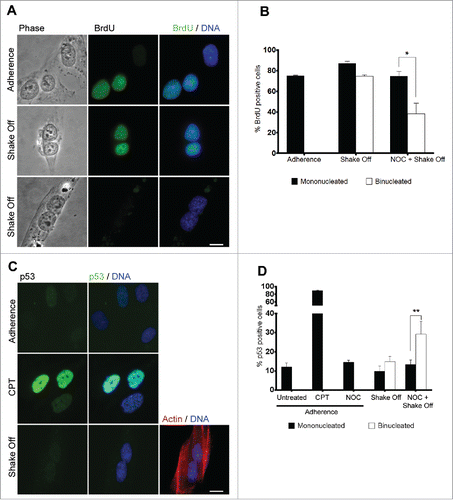
Figure 3. Binucleated cells induced by cytokinesis in suspension progress through S phase. (A) Representative images of BrdU incorporation in mononucleated cells grown in adherence or in binucleated cells obtained 20 hrs after cytokinesis in suspension. (B) Frequency of BrdU-positive cells among mononucleated cells grown in adherence and mononucleated or binucleated cells obtained 20 hrs after cytokinesis in suspension (Shake off) or after cytokinesis in suspension with a 3 hr NOC pre-treatment (NOC + Shake off). Results shown are the mean ± SEM of 3 independent experiments. For each experiment at least 200 mononucleated cells were analyzed in adherence condition, 200 mononucleated and 50 binucleated cells after cytokinesis in suspension. (C) Representative images of p53 immunostaining in cells grown in adherence (Adherence), after camptothecin treatment (CPT), or in binucleated cells obtained 20 hrs after cytokinesis in suspension (Shake off). Binucleation was confirmed by actin immunostaining. (D) Frequency of p53-positive cells in cells grown in adherence (untreated), after camptothecin treatment (CPT) or nocodazole exposure (NOC) in adherence, and in mononucleated or binucleated cells obtained 20 hrs after cytokinesis in suspension (Shake off) or after cytokinesis in suspension with a 3hr NOC pre-treatment (NOC + Shake off). Results shown are the mean ± SEM of 3 independent experiments. For each experiment at least 500 mononucleated cells were analyzed in adherence conditions, 200 mononucleated and 50 binucleated cells after cytokinesis in suspension. *P<0.05; **P<0.01 (Student's t-test). Scale bar = 5 μm.

Figure 4. Binucleated cells induced by cytokinesis in suspension arrest in G2 and accumulate p53. (A) Frequency of cyclin B-positive cells among mononucleated cells grown in adherence (Untreated), after camptothecin treatment (CPT) and in mononucleated or binucleated cells obtained 40 hrs after cytokinesis in suspension (Shake off). For each of the 2 experiments at least 500 mononucleated cells were analyzed in adherence conditions, 200 mononucleated and 50 binucleated cells after cytokinesis in suspension. (B) Representative images of p53 and cyclin B immunostaining in cells grown in adherence (Adherence), after camptothecin treatment (CPT), or in binucleated cells obtained 40 hrs after cytokinesis in suspension (Shake off). (C) The graph shows the mean ± SEM of p53 fluorescence intensity (arbitrary units) in cyclin B positive cells grown in adherence (untreated), after camptothecin treatment (CPT), and in mononucleated or binucleated cells obtained 40 hrs after cytokinesis in suspension (Shake off). For each condition, 2 replicate cultures (at least 50 cells/culture) were analyzed. *P<0.05; **P<0.01 ***P<0.001 (Student's t-test). Scale bar = 5 μm.
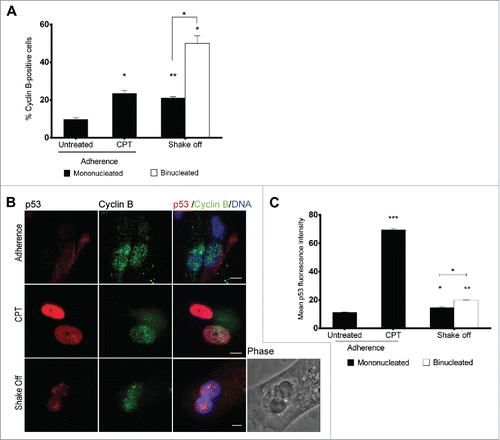
Figure 4. Binucleated cells induced by cytokinesis in suspension arrest in G2 and accumulate p53. (A) Frequency of cyclin B-positive cells among mononucleated cells grown in adherence (Untreated), after camptothecin treatment (CPT) and in mononucleated or binucleated cells obtained 40 hrs after cytokinesis in suspension (Shake off). For each of the 2 experiments at least 500 mononucleated cells were analyzed in adherence conditions, 200 mononucleated and 50 binucleated cells after cytokinesis in suspension. (B) Representative images of p53 and cyclin B immunostaining in cells grown in adherence (Adherence), after camptothecin treatment (CPT), or in binucleated cells obtained 40 hrs after cytokinesis in suspension (Shake off). (C) The graph shows the mean ± SEM of p53 fluorescence intensity (arbitrary units) in cyclin B positive cells grown in adherence (untreated), after camptothecin treatment (CPT), and in mononucleated or binucleated cells obtained 40 hrs after cytokinesis in suspension (Shake off). For each condition, 2 replicate cultures (at least 50 cells/culture) were analyzed. *P<0.05; **P<0.01 ***P<0.001 (Student's t-test). Scale bar = 5 μm.

Figure 5. Binucleated cells induced by cytokinesis in suspension are arrested in G2 through a ATR/Chk1 dependent pathway and enter senescence. (A) Representative images of near 2N and near 4N metaphase spreads. (B) Frequency of near 4N metaphases in chromosome spreads obtained from exponentially growing cultures (Adherence), 48 or 96 hrs after cytokinesis in suspension in the absence (Shake Off ) or in the presence of 5 mM caffeine (Shake Off + CAF) for 6 hr prior to harvesting. Results shown are the mean ± SEM of 2 independent experiments (200-400 metaphases were analyzed per each sample). (C) Frequency of near 4N metaphases in chromosome spreads obtained 48 hrs after cytokinesis in suspension in the absence (Shake Off) or in the presence of 5 μM LY2603618 (Shake Off + LY2603618) for 6 hrs prior to harvesting. Results shown are the mean ± SEM of 2 independent experiments (200-400 metaphases were analyzed per each sample). (D) Representative images of mononucleated and binucleated cells identified by phase contrast and stained for the senescence marker β-Galactosidase (SA-β Gal). SA-β Gal positive and negative cells are indicated by black and white arrows, respectively. (E) Frequency of SA-β Gal positive cells in exponentially growing cultures (untreated), 48 or 96 hrs after H2O2 treatment of adherent cells, and 48 or 96 hrs after cytokinesis in suspension (Shake off). Results shown are the mean ± SEM of 2 independent experiments. (500-1000 mononucleated and 300-400 binucleated cells were counted per sample). *P <0.05 (Student's t-test). Scale bar = 5 μm.
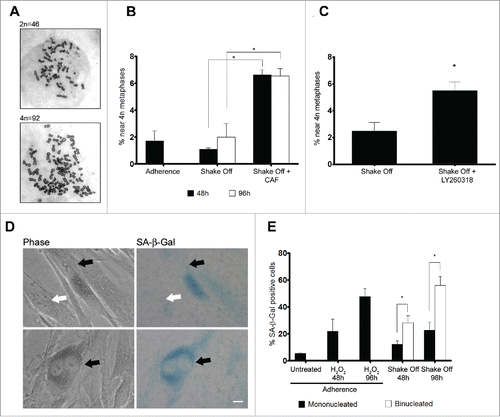
Figure 5. Binucleated cells induced by cytokinesis in suspension are arrested in G2 through a ATR/Chk1 dependent pathway and enter senescence. (A) Representative images of near 2N and near 4N metaphase spreads. (B) Frequency of near 4N metaphases in chromosome spreads obtained from exponentially growing cultures (Adherence), 48 or 96 hrs after cytokinesis in suspension in the absence (Shake Off ) or in the presence of 5 mM caffeine (Shake Off + CAF) for 6 hr prior to harvesting. Results shown are the mean ± SEM of 2 independent experiments (200-400 metaphases were analyzed per each sample). (C) Frequency of near 4N metaphases in chromosome spreads obtained 48 hrs after cytokinesis in suspension in the absence (Shake Off) or in the presence of 5 μM LY2603618 (Shake Off + LY2603618) for 6 hrs prior to harvesting. Results shown are the mean ± SEM of 2 independent experiments (200-400 metaphases were analyzed per each sample). (D) Representative images of mononucleated and binucleated cells identified by phase contrast and stained for the senescence marker β-Galactosidase (SA-β Gal). SA-β Gal positive and negative cells are indicated by black and white arrows, respectively. (E) Frequency of SA-β Gal positive cells in exponentially growing cultures (untreated), 48 or 96 hrs after H2O2 treatment of adherent cells, and 48 or 96 hrs after cytokinesis in suspension (Shake off). Results shown are the mean ± SEM of 2 independent experiments. (500-1000 mononucleated and 300-400 binucleated cells were counted per sample). *P <0.05 (Student's t-test). Scale bar = 5 μm.
Supplemental material

KCCY_S_1127469.zip

Download Zip (2.1 MB)

Reprints and Corporate Permissions

Please note: Selecting permissions does not provide access to the full text of the article, please see our help page How do I view content?

To request a reprint or corporate permissions for this article, please click on the relevant link below:

Academic Permissions

Please note: Selecting permissions does not provide access to the full text of the article, please see our help page How do I view content?

Obtain permissions instantly via Rightslink by clicking on the button below:

If you are unable to obtain permissions via Rightslink, please complete and submit this Permissions form. For more information, please visit our Permissions help page.