Figures & data
Figure 1. (A) Western blot analysis of PTEN basal expression on human HCC cell lines. (B) Chemical structure of PTEN inhibitor hydroxy(oxo)vanadium 3-hydroxypyridine-2-carboxylic acid trihydrate (VO-OHpic). (C) Western blot analysis of PTEN-regulated phospho proteins AKT, mTOR and ERK1/2 in Hep3B, PLC/PRF/5 and SNU475 cells. The numbers represent the ratio of the relevant protein normalized with β-actin, with vehicle-treated control samples (–) arbitrarily set at 1.0. The data shown represent two independent experiments with comparable outcomes.
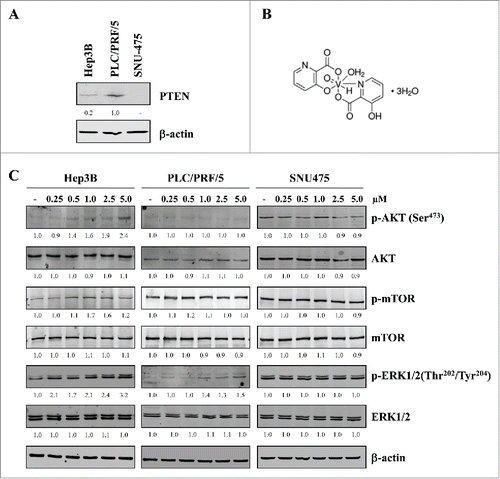
Figure 2. PTEN inhibition reduces cell viability, cell proliferation and colony forming ability in Hep3B and PLC/PRF/5 cells. (A) Cell viability in each HCC cell line was assessed by MTS assays. Cells were treated with increasing concentrations of VO-OHpic for 120 hours. Data are expressed as the percentage of control cells and are the means ± SD of three separate experiments, each of which was performed in triplicate. (B) DNA synthesis was measured by BrdU incorporation into DNA. Cells were treated with the indicated concentrations of VO-OHpic. Data are expressed as the percentage of control cells and are the means ± SD of three separate experiments, each of which was performed in triplicate. (C-D) Cell viability in each HCC cell line was assessed by MTS assays. Cells were treated with increasing concentrations of PTPi I (C) or NSC87877 (D) for 120 hours. Data are expressed as the percentage of control cells and are the means ± SD of three separate experiments, each of which was performed in triplicate. (E) Representative images of clonogenic assay after treatment with VO-OHpic. Hep3B, PLC/PRF/5 and SNU475 cells were plated overnight and exposed to VO-OHpic at the indicated concentrations every 48 hours. These experiments continued for 14 days in Hep3B and PLC/PRF/5 cells and for 10 days in SNU475 cells. Surviving colonies were stained and counted. (F) Data are expressed as the number of colonies and are the means ± SD of two separate experiments, each of which was performed in duplicate.
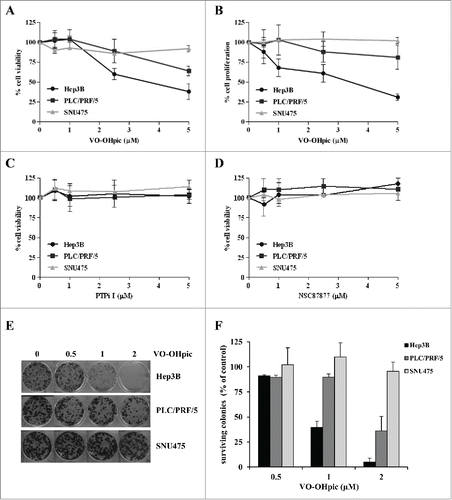
Figure 3. VO-OHpic treatment induced senescence-associated β-galactosidase (SA-β-Gal) and senescence-associated secretory phenotype (SASP) in Hep3B cells. (A) Representative images of Hep3B, PLC/PRF/5 and SNU475 cells treated with the indicated concentrations of VO-OHpic. VO-OHpic was added every 72 hours, and after five days senescent cells were identified by SA-β-Gal assay. (B) Data are expressed as the number of SA-β-Gal positive cells and are the means ± SD of two separate experiments, each of which was performed in duplicate. (C) Expression of IL8 and MMP9 mRNAs were analyzed by quantitative RT-PCR in HCC cells. Hep3B, PLC/PRF/5 and SNU475 cells were treated with the 500 nM of VO-OHpic for 72 hours. Relative expression was calculated as ratio of drug-treated samples versus control (DMSO) and corrected by the quantified expression level of β-actin. The results shown are the means ± SD of three experiments, each performed in triplicate.
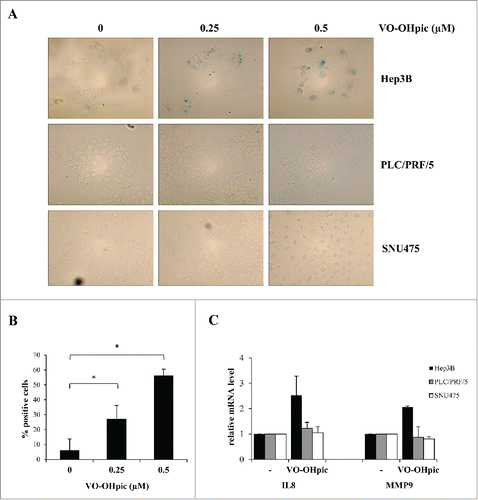
Figure 4. VO-OHpic induced cell cycle arrest and increased the expression of p21 mRNA in Hep3B cells. (A) Representative images of cell cycle analysis in Hep3B, PLC/PRF/5 and SNU475 cells treated with 500 nM of VO-OHpic for 72 hours. Cells were stained with propidium iodide and DNA content of cells was analyzed by flow cytometry. (B) Expression of p21 and p16 mRNAs were analyzed by quantitative RT-PCR in HCC cells. Hep3B, PLC/PRF/5 and SNU475 cells were treated with the 500 nM of VO-OHpic for 72 hours. Relative expression was calculated as ratio of drug-treated samples versus control (DMSO) and corrected by the quantified expression level of β-actin. The results shown are the means ± SD of three experiments, each performed in triplicate.
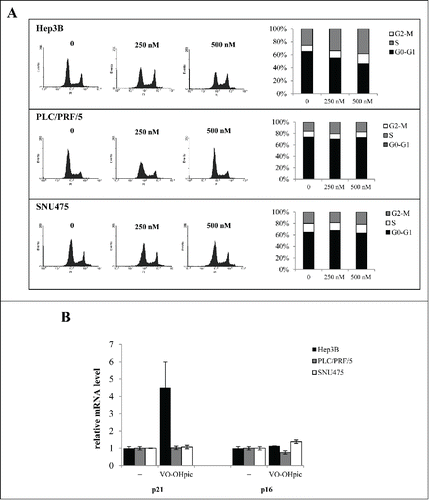
Table 1. VO-OHpic in combination with sorafenib, U0126, and BEZ235 elicited synergistic inhibition of cell viability in Hep3B cells. The combination index (CI) values are indicated.
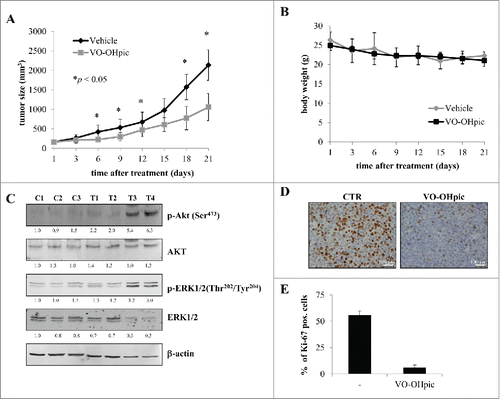
Figure 5. The effect of VO-OHpic on xenograft models of Hep3B cells. (A) Effect of VO-OHpic on tumor growth. Once tumors were engrafted and palpable, mice (n=6) were treated daily (6 days/week) with VO-OHpic at 10 mg/kg, as described in Materials and Methods. The curve of tumor growth was compared with that of control mice treated with vehicle alone, *p < 0.05. (B) Body weight alteration analysis. Mice were weighed twice a week and the weights presented in the graphs. (C) Representative Western blotting showing phospho-AKT, AKT, phospho-ERK1/2 and ERK1/2 levels of three mice treated with vehicle alone (control; C1, C2 and C3) and four mice treated with VO-OHpic (T1, T2, T3 and T4). The numbers represent the ratio of the relevant protein normalized with β-actin, with vehicle-treated control sample C1 arbitrarily set at 1.0. (D) Immunohistochemical staining was performed on formalin-fixed paraffin-embedded tumor tissues. Tissues from the control mice and mice treated with VO-OHpic were stained for Ki-67 proliferation index (20 x magnification). (E) Data are expressed as the number of positive cells and are the means ± SD of five fields in three tumor sections from mice treated with vehicle alone and in four tumor sections from mice treated with VO-OHpic.