Figures & data
Figure 1. Inverse correlation between pS824-KAP1 foci and RNF4 abundance. (A) pS824-KAP1 foci are mainly present in cyclin A (-) cells. Co-staining of pS824-KAP1 and cyclin A in cycling MCF7 cells at 1-h post-IR (4 Gy). The foci were visualized with immunofluorescence (IF) microscopy using indicated antibodies and DAPI. Scale bar: 10 μm. (B) pS824-KAP1 is abundantly present in G0-/G1-phases, but not in S-/G2-phases. MCF7 cells were synchronized and then irradiated as indicated. Upper panel: Western blot analyses were performed to assess the abundance of indicated proteins. Lower panel: cell cycle analyses of synchronous cells. Numbers represent the percentage of cells in each cell cycle phase. Asy: asynchronous; SS: serum starvation; APH, 4h: release from aphidicolin treatment for 4-h. (C) RNF4 abundance is regulated during cell cycle progression. MCF7 cells were synchronized by serum starvation and then released as indicated. Upper panel: RNF4 abundance was assessed by Western blot analysis. Lower panel: cell cycle analyses of synchronous cells. Numbers represent the percentage of cells in each cell cycle phase. (D) Dynamic level of RNF4 at different stages of cell cycle. MCF7 cells were synchronized at different stages of cell cycle as indicated. Western blot analyses were used to assess the abundance of the indicated proteins. (B-D) N = 3, representative blots were shown.
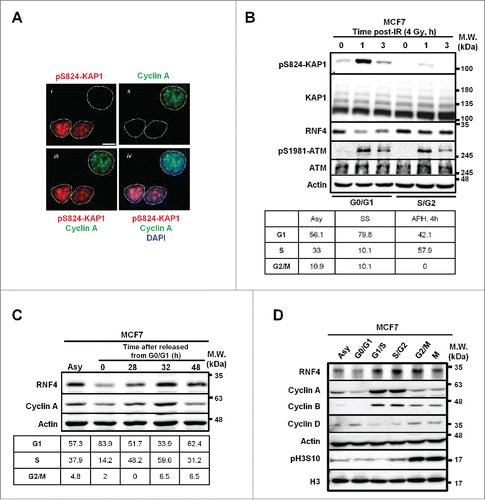
Figure 2. Cell cycle-dependent regulation of RNF4. (A) Static RNF4 mRNA level during cell cycle progression. Upper panel: RNF4 message levels were assessed by quantitative RT-PCR (qRT-PCR) in MCF7 cells synchronized at different stages of cell cycle. Bars: mean ± SD, N = 3; ns: not significant (one-way ANOVA). Lower panel: cell cycle distribution in synchronous MCF7 cells. Numbers represent the percentage of cells in each cell cycle phase. (B) RNF4 is stabilized by MG132 upon serum starvation. Serum-starved MCF7 cells were pre-treated with MG132 for the indicated time periods prior to harvesting. RNF4 levels were detected by Western blot analyses. (C) The stability of RNF4 is not affected by DNA damage. MCF7 cells treated with cycloheximide (CHX) in the presence of doxorubicin (Dox), ATM inhibitor (ATMi) Ku55933, or proteasome inhibitor MG132 were assessed for RNF4 protein abundance by Western blot analyses. (D) Knocking down CDK2 prevents the accumulation of RNF4 in S-/G2-phases. MCF7 cells were transfected with control siRNA (siCON), siCDK2, siCDK4, followed by synchronization at different cell cycle stages. RNF4 protein abundance was assessed by Western blot analyses. Italic numbers represent the quantification of RNF4 protein levels. (B, C) N = 3, representative blots were shown.
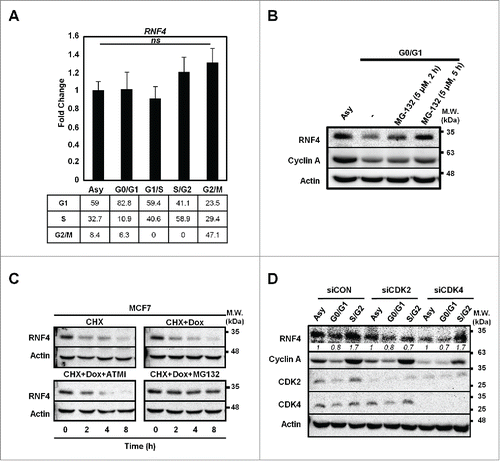
Figure 3. p97 partakes in the regulation of pS824-KAP1. (A) Time-dependent formation and degradation of pS824-KAP1 foci. The pS824-KAP1 foci were examined in irradiated MCF7, MCF7/shKAP1 and MCF7/shRNF4 cells (8 Gy). Cells were fixed at the indicated time points post-IR and pS824-KAP1 and γ-H2AX foci visualized by IF staining. (B) p97 is co-localized to where KAP1 and RNF4 interact. KAP1 (625-835)-VN173 and RNF4 (WT)-CC155 were co-transfected into U2OS cells. After 48-h, cells were pre-treated with MG132 (5 μM) for 4-h prior to IR exposure. Cells were fixed at 1-h following irradiation (4 Gy). Green: KAP1-RNF4 interaction; Red: p97. Scale bar: 5 µm. (C) Interaction of RNF4 with p97. HEK293 cells were co-transfected with SFB-RNF4 and p97-His-Myc followed by treating with Dox (3 μM) for the indicated time periods. Cell lysates were incubated with S-beads to pull down SFB-RNF4-associated complex followed by Western blot analysis. p97-His-Myc was detected by anti-Myc antibody. 5% input control was blotted with the indicated antibodies. (D) pS824-KAP1 signal was further enhanced in MCF7/shRNF4 cells treated with DBeQ or sip97. Cells were transfected with siRNA against p97 or treated with DBeQ (10 μM) in the presence of vehicle or Dox (3 μM). pS824-KAP1, total KAP1, pS1981-ATM, total ATM were assessed by blotting with the corresponding antibodies. β-actin served as loading control. (E) p97 inhibitor sensitizes MCF7 cells to IR. MCF7 cells were treated with DBeQ (200 nM) and increasing dose of IR. Colonies were fixed and stained with crystal violet at 12-days after treatment. Surviving fraction was calculated with a correction for the plating efficiency. Bars: mean ± SD; *: p < 0.02.
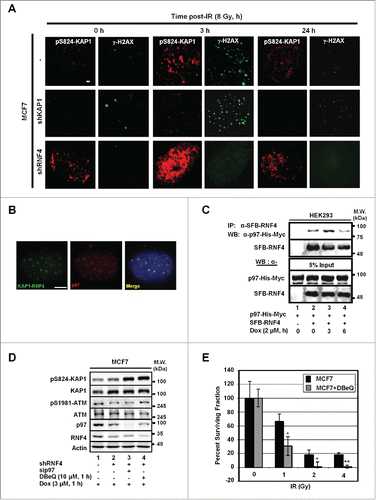
Figure 4. Irradiation induces the co-appearance of pS824-KAP1 foci with 53BP1, but not BRCA1 foci. (A) Lack of co-appearance of DSB-induced pS824-KAP1 and BRCA1 foci in MCF7 cells. Cycling MCF7 cells were irradiated (4 Gy). At 1-h post-IR, cells were fixed and immunostained with anti-pS824-KAP1, anti-53BP1 or anti-BRCA1 antibodies to detect foci. Scale bar: 10 μm. (B) Knockdown of KAP1 impairs the recruitment of 53BP1 to DSB sites in cyclin A (-) cells. Co-staining of 53BP1 and cyclin A in MCF7 cells transfected with a control siRNA or an siRNA that targeted KAP1. Knockdown efficiency of siRNA targeting KAP1 is validated by Western blot (inset). Following IR (4 Gy), cells were allowed to recover for 1-h. At least 30 cells were analyzed for 53BP1 foci and the corresponding level of cyclin A (right panel, bars: mean ± SD). (C) Depletion of KAP1 enhances BRCA1 recruitment to DSB sites in cyclin A (-) cells. Co-staining of BRCA1 and cyclin A in MCF7 cells transfected with control siRNA or an siRNA that targeted KAP1. Following IR (4 Gy), cells were allowed to recover for 1-h, and then 100 cells were analyzed for BRCA1 foci and the corresponding level of cyclin A.
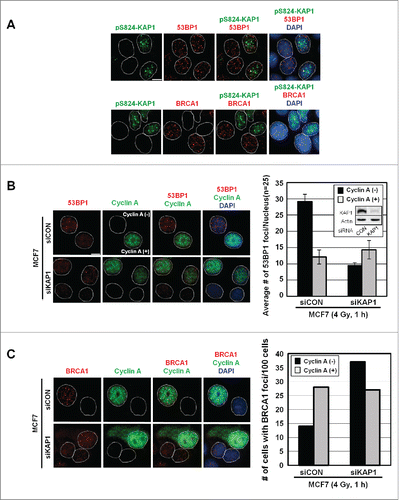
Figure 5. RNF4 and KAP1 have opposite effects on HR repair. (A) Both KAP1 and RNF4 contribute to NHEJ repair. HEK293 cells were transfected with control siRNA, siKAP1 or siRNF4 or both siKAP1 and siRNF4. The knockdown efficiency of KAP1 and RNF4, and the transfection efficiency of pCBASce were confirmed by Western blot. *: p < 0.005; ns: not significant. The relative frequencies of NHEJ repair of EJ5-GFP, which results in GFP-positive cells, are shown for each transfection. (B) KAP1 or RNF4-depletion reduces 53BP1 foci in MCF7 cells. MCF7, MCF7/shKAP1 and MCF7/shRNF4 cells were fixed and stained for 53BP1 after exposure to IR (3 Gy) and allowed to recover for 1-h. Enumeration of 53BP1 foci was done in 25 nuclei for each cell type. The average number of 53BP1 foci per nucleus was 36.72 ± 9.49 in MCF7 cells, 18.40 ± 3.85 in MCF7/shKAP1 cells (p < 0.001), and 15.28 ± 5.31 in MCF7/shRNF4 cells (p < 0.001). (C) Knockdown of KAP1 enhances HR repair. The relative frequencies of the repair of DR-GFP by HR, which results in GFP-positive cells, in HEK293 cells transfected with control siRNA, siKAP1, siRNF4 or both are shown. *: p < 0.005; **: p < 0.001. (D) KAP1 or RNF4-depletion has opposite effects on RAD51 recruitment. Cells were fixed at the indicated times post-IR. The number of RAD51 foci per cell and percent cells with RAD51 foci out of 90 cells in each cell line is shown for each time point. *: p < 0.05; **: p < 0.01. (A-D) Bars: mean ± SD.
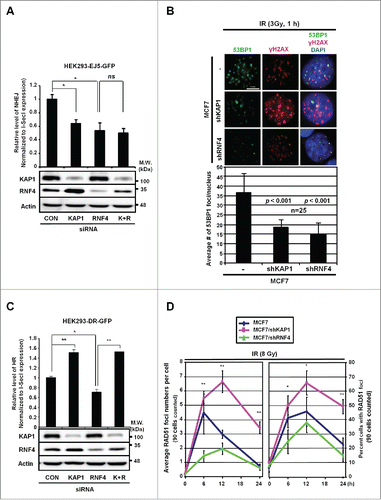
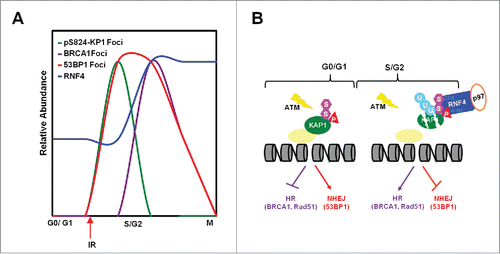
Figure 6. RNF4 regulates the choice of DNA repair pathways. (A) The relative abundance of pS8234-KAP1 foci, BRCA1 foci, 53BP1 foci and RNF4 level in different phases of cell cycle. (B) Diagram depicting cell cycle-dependent recruitment of RNF4 to pS824-SUMO-KAP1 regulates the accumulation of 53BP1 and BRCA1 foci at DSB sites, hence the choice of DNA repair pathways.