968
Views
9
CrossRef citations to date
0
Altmetric
Report

Hmga1 null mouse embryonic fibroblasts display downregulation of spindle assembly checkpoint gene expression associated to nuclear and karyotypic abnormalities

, , , , , , & show all
Pages 812-818 | Received 06 Jul 2015, Accepted 20 Jan 2016, Published online: 30 Mar 2016

Figures & data

Figure 1. HMGA1 modulates Bub1, Bub1b, Mad2l1 and Ttk mRNA expression levels in MEFs. RNA and proteins extracted from Hmga1+/+ and Hmga1−/− MEFs were analyzed by qRT-PCR for Bub1, Bub1b, Mad2l1 and Ttk expression (A) and by western blotting using the indicated antibodies (B). The actin expression level has been used for data normalization. qRT-PCR values are mean ± SD of a representative experiment performed in triplicate. (C) RNA extracted from Hmga1−/− MEFs transiently transfected with empty vector (CV) or pcDNA3.1-Hmga1b expression vector was analyzed by qRT-PCR for Bub1, Bub1b, Mad2l1 and Ttk expression. Values are mean ± SD of a representative experiment performed in triplicate.
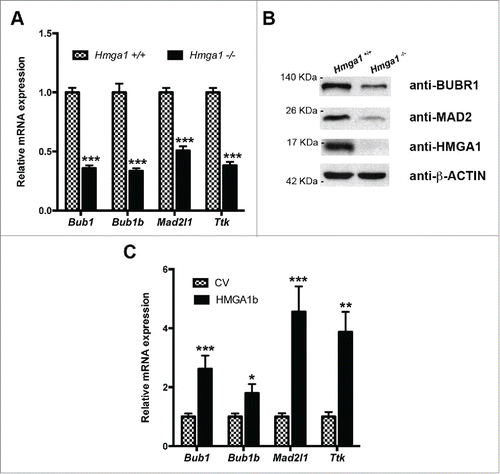
Figure 1. HMGA1 modulates Bub1, Bub1b, Mad2l1 and Ttk mRNA expression levels in MEFs. RNA and proteins extracted from Hmga1+/+ and Hmga1−/− MEFs were analyzed by qRT-PCR for Bub1, Bub1b, Mad2l1 and Ttk expression (A) and by western blotting using the indicated antibodies (B). The actin expression level has been used for data normalization. qRT-PCR values are mean ± SD of a representative experiment performed in triplicate. (C) RNA extracted from Hmga1−/− MEFs transiently transfected with empty vector (CV) or pcDNA3.1-Hmga1b expression vector was analyzed by qRT-PCR for Bub1, Bub1b, Mad2l1 and Ttk expression. Values are mean ± SD of a representative experiment performed in triplicate.

Figure 2. Lack of HMGA1 expression induces nuclear abnormalities, micronuclei and binucleation. (A) Hmga1+/+ and Hmga1−/− MEFs were stained with DAPI and anti-β-tubulin antibody to identify the nuclei and the cytoplasm, respectively. About 1,000 cells per sample were scored for the presence of aberrantly-shaped nuclei, micronuclei and for the presence of one or 2 nuclei/cell. The data are represented as mean SD. Differences between Hmga1+/+ and Hmga1−/− are statistically significant: **p < 0.01 for micronucleated, and *p < 0.05 for binucleated cells and aberrant cells, n = 3 independent experiments. (B-C) Representative fields of Hmga1+/+ and Hmga1−/− cells at p3 and p6. Staining with anti-β-tubulin antibody and DAPI (B); brightfield (C). Dashed arrows indicate binucleated cells. Solid arrows indicate micronuclei. Scale bar, 10 µm. (D) Proliferation rate of Hmga1+/+ and Hmga1−/− MEFs at culture passage 3. Cells were plated and counted daily for 7 d. Values represent mean +/− SEM.
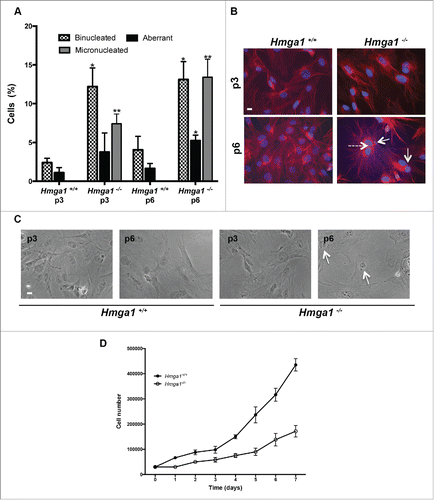
Figure 2. Lack of HMGA1 expression induces nuclear abnormalities, micronuclei and binucleation. (A) Hmga1+/+ and Hmga1−/− MEFs were stained with DAPI and anti-β-tubulin antibody to identify the nuclei and the cytoplasm, respectively. About 1,000 cells per sample were scored for the presence of aberrantly-shaped nuclei, micronuclei and for the presence of one or 2 nuclei/cell. The data are represented as mean SD. Differences between Hmga1+/+ and Hmga1−/− are statistically significant: **p < 0.01 for micronucleated, and *p < 0.05 for binucleated cells and aberrant cells, n = 3 independent experiments. (B-C) Representative fields of Hmga1+/+ and Hmga1−/− cells at p3 and p6. Staining with anti-β-tubulin antibody and DAPI (B); brightfield (C). Dashed arrows indicate binucleated cells. Solid arrows indicate micronuclei. Scale bar, 10 µm. (D) Proliferation rate of Hmga1+/+ and Hmga1−/− MEFs at culture passage 3. Cells were plated and counted daily for 7 d. Values represent mean +/− SEM.

Figure 3. Down-regulation of HMGA1 by RNAi induces binucleation in MEFs. (A) Control (Ctli) and HMGA1-depleted (HMGA1i) WT MEFs were tested for the expression of HMGA1 and SAC genes by qPCR 72 hours post transfection. The actin expression level has been used for data normalization. qRT-PCR values are mean ± SD of a representative experiment performed in triplicate. (B) As described in “Materials and Methods” section, after 2 rounds of transfection, Ctli and HMGA1i MEFs were stained with DAPI and anti-β-tubulin antibody to identify the nuclei and the cytoplasm, respectively. About 1,000 cells per sample were scored for the presence of binucleated cells. The data are represented as mean ±SD. Differences between Ctli and HMGA1i MEFs are statistically significant for binucleated cells (*p < 0.05). (C) Representative fields of Ctli and HMGA1i MEFs, staining with anti-β-tubulin antibody and DAPI. Dashed arrows indicates binucleated cells. Scale bar, 10 µm.
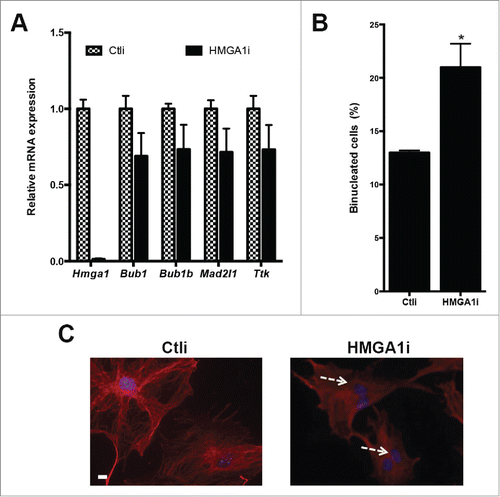
Figure 3. Down-regulation of HMGA1 by RNAi induces binucleation in MEFs. (A) Control (Ctli) and HMGA1-depleted (HMGA1i) WT MEFs were tested for the expression of HMGA1 and SAC genes by qPCR 72 hours post transfection. The actin expression level has been used for data normalization. qRT-PCR values are mean ± SD of a representative experiment performed in triplicate. (B) As described in “Materials and Methods” section, after 2 rounds of transfection, Ctli and HMGA1i MEFs were stained with DAPI and anti-β-tubulin antibody to identify the nuclei and the cytoplasm, respectively. About 1,000 cells per sample were scored for the presence of binucleated cells. The data are represented as mean ±SD. Differences between Ctli and HMGA1i MEFs are statistically significant for binucleated cells (*p < 0.05). (C) Representative fields of Ctli and HMGA1i MEFs, staining with anti-β-tubulin antibody and DAPI. Dashed arrows indicates binucleated cells. Scale bar, 10 µm.

Figure 4. Lack of HMGA1 expression induces karyotypic alterations. (A) The graph shows the percentages of Hmga1+/+, Hmga1+/− and Hmga1−/− MEFs with the indicated chromosome number at two different culture passages (p3 and p6). The number of analyzed metaphases for each sample has been indicated. (B) Representative images of karyotypes of indicated MEFs with different chromosome number.
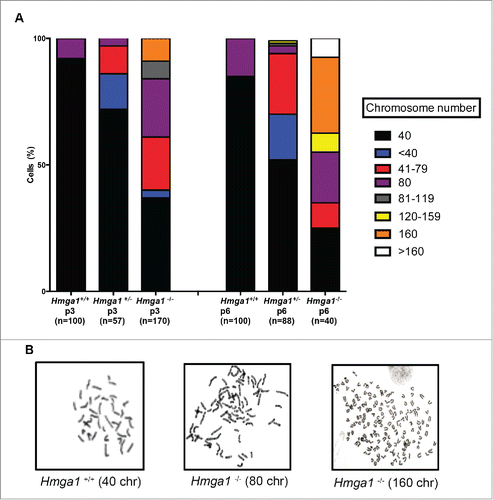
Figure 4. Lack of HMGA1 expression induces karyotypic alterations. (A) The graph shows the percentages of Hmga1+/+, Hmga1+/− and Hmga1−/− MEFs with the indicated chromosome number at two different culture passages (p3 and p6). The number of analyzed metaphases for each sample has been indicated. (B) Representative images of karyotypes of indicated MEFs with different chromosome number.

Reprints and Corporate Permissions

Please note: Selecting permissions does not provide access to the full text of the article, please see our help page How do I view content?

To request a reprint or corporate permissions for this article, please click on the relevant link below:

Academic Permissions

Please note: Selecting permissions does not provide access to the full text of the article, please see our help page How do I view content?

Obtain permissions instantly via Rightslink by clicking on the button below:

If you are unable to obtain permissions via Rightslink, please complete and submit this Permissions form. For more information, please visit our Permissions help page.