1,587
Views
22
CrossRef citations to date
0
Altmetric
Extra View

MYC and PVT1 synergize to regulate RSPO1 levels in breast cancer

, , , &
Pages 881-885 | Received 30 Nov 2015, Accepted 21 Jan 2016, Published online: 14 Apr 2016

Figures & data

Figure 1. (A) Schematic of the engineered MMTV-Neu mouse model for the Gain (Myc), Gain (Pvt1) and Gain (Myc-Pvt1) animals from which mammary epithelium was obtained. Following RNA-SEQ analyses FPKM transcript abundance further normalized by the levels observed for Actb for (B) Actb, Myc and Pvt1 and (C) Dmbt1, Lrrc1, and Rspo1 are plotted using colors defined in the engineering schematic above.
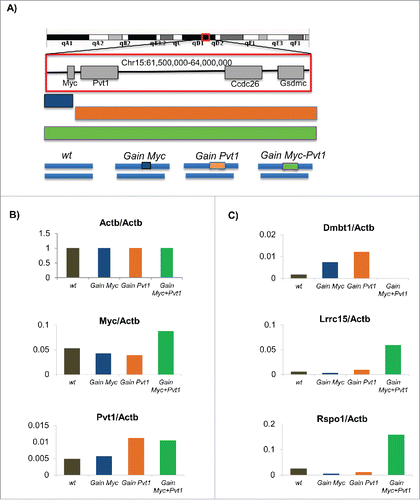
Figure 1. (A) Schematic of the engineered MMTV-Neu mouse model for the Gain (Myc), Gain (Pvt1) and Gain (Myc-Pvt1) animals from which mammary epithelium was obtained. Following RNA-SEQ analyses FPKM transcript abundance further normalized by the levels observed for Actb for (B) Actb, Myc and Pvt1 and (C) Dmbt1, Lrrc1, and Rspo1 are plotted using colors defined in the engineering schematic above.

Figure 2. (A) Myc transcript abundance for 849 TCGA Breast cancer tumors sorted by increasing Myc transcript abundance. Tumors within the bottom Quartile are shown in gray and tumors within the top quartile are shown in black. (B) Dot plot comparison of bottom quartile of transcript values compares to top quartile transcript for Myc, Pvt1, Rspo1 and ActB. A two group T-test shows that the Pvt1 and Rspo1 are both significantly higher and show a large average fold change in the top quartile relative to the bottom quartile based on Myc transcript level. ActB is not significantly different by T-test and also by fold change.
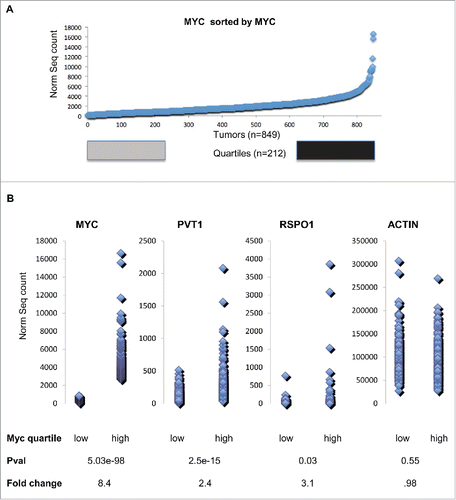
Figure 2. (A) Myc transcript abundance for 849 TCGA Breast cancer tumors sorted by increasing Myc transcript abundance. Tumors within the bottom Quartile are shown in gray and tumors within the top quartile are shown in black. (B) Dot plot comparison of bottom quartile of transcript values compares to top quartile transcript for Myc, Pvt1, Rspo1 and ActB. A two group T-test shows that the Pvt1 and Rspo1 are both significantly higher and show a large average fold change in the top quartile relative to the bottom quartile based on Myc transcript level. ActB is not significantly different by T-test and also by fold change.
Supplemental material

1149660_Supplemental_Material.zip

Download Zip (1 MB)

Reprints and Corporate Permissions

Please note: Selecting permissions does not provide access to the full text of the article, please see our help page How do I view content?

To request a reprint or corporate permissions for this article, please click on the relevant link below:

Academic Permissions

Please note: Selecting permissions does not provide access to the full text of the article, please see our help page How do I view content?

Obtain permissions instantly via Rightslink by clicking on the button below:

If you are unable to obtain permissions via Rightslink, please complete and submit this Permissions form. For more information, please visit our Permissions help page.