Figures & data
Figure 1. Generation of Flp-In NIH-3T3 cells. A) Low-level stable expression of GFP, Jade-1S WT or Jade-1S S18/20A coding sequences was achieved using the Flp-In™-3T3 system with the C-terminally GFP tagged vector pgLAP5. All Flp-In cell lines were positive for GFP expression as assessed by immuno-fluorescence (top panel) after PFA-fixation. Exposure time for GFP.GFP cells was 50% of that required to visualize the Jade-1S.GFP-expressing lines. DAPI co-stain indicates nuclei (bottom panel). Scale bar = 50 µm. B) Confluent cell lines were prepared as whole cell lysates (WCL) and assessed by immunoblot for GFP expression. IB, immunoblot.
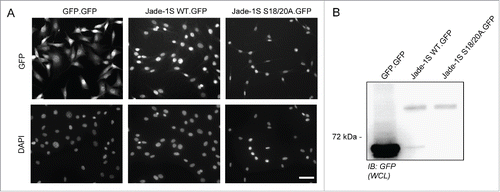
Figure 2. Jade-1S interactome is altered by S18/20A mutation. Volcano plots showing significant interactors of wild-type Jade-1S.GFP (A) and Jade-1S S18/20A.GFP (B). The decadic logarithm of the p-value is plotted against the logarithmic fold change of the respective Jade-1S IP as compared to the control IP. Proteins determined to be interactors are labeled with the gene symbol. C) Hierarchical clustering of protein intensities (LFQ values) analyzing the effect of phospho-ablating mutations on the Jade interactors. Results from 4 independent experimental replicates cluster for wild-type Jade-1S.GFP (WT), Jade-1S S18/20A.GFP (S18/20A) and control GFP.GFP (GFP) expressing cell lines. HBO1 was a strong interacting partner for both Jade-1S expressing cell lines but not for the control GFP.GFP cell line. The profile for the Jade-1S S18/20A.GFP line showed an overall increase in interaction partners (–= uncharacterized protein C1orf131 homolog). D) 2D-GO-enrichment analysis showing significantly enriched GO terms. The scatter plot shows comparison between the significant GO-enrichments within the Jade-1S S18/20A.GFP interactome (Y-axis) and the wild-type Jade-1S.GFP (X-axis) interactome. The dashed line indicates GO terms enriched equally in both samples. The mutant Jade-1S S18/20A.GFP line showed increased interaction compared to the wild-type Jade-1S.GFP line for proteins related to the NuRD complex, histone deacetylation, transcriptional repression, ribosome biogenesis, and chromatin remodeling.
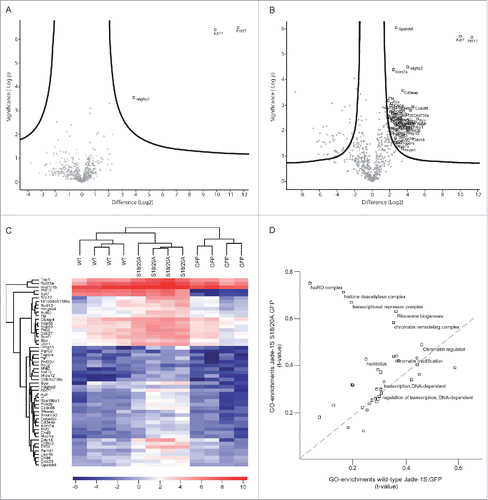
Figure 3. Growth of Flp-In NIH-3T3 cells is altered by single-copy Jade-1S insertion. A) The mutant Jade-1S S18/20A.GFP cell line displayed an elongated cell shape as cells approached confluency. If allowed to grow until super-confluent, Jade-1S S18/20A.GFP cells displayed increased membrane spreading, and nuclei did not achieve close proximity as was seen in the other cells. Scale = 50 µm. B) Cells were seeded at 200 000 per 10 cm culture dish and counted 48h and 96h later. Fold change from 48h to 96h is shown. The Jade-1S S18/20A.GFP line proliferated significantly more slowly than the control GFP.GFP line (F(2,4) = 8.553, p = 0.0359; Tukey's post hoc, * = p <0.05). C) Representative histograms of propidium iodide (PtdIns) staining of each Flp-In cell line. Cells were seeded at 2 × 10e6 /10 cm dish and harvest after 24 hours for flow cytometry. D, E, F) Quantification of flow cytometry data where the first histogram peak corresponds to cells in G1/G0 phase (2n DNA) and the second peak to G2/M (4n DNA), with S phase corresponding to cells with an intermediary DNA status. The percentage of cells in cell cycle phases G1/G0 (D), S (E), and G2/M (F) was calculated for each Flp-In cell line using Cyflogic software. Results were analyzed using repeated measures ANOVA to maintain integrity of individual experimental repetitions. The wild-type Jade-1S.GFP and the mutant Jade-1S S18/20A.GFP cell lines had a significantly increased percentage of cells in G1/G0 (D) (F(2,4) = 13.77, p = 0.0161; Tukey's post hoc *, p < 0.05; **, p < 0.01). A significantly smaller percentage of wild-type Jade-1S expressing cells were in S-phase compared to the control GFP.GFP expressing cells (E) (F(2,4) = 11.15, p = 0.0231; Tukey's post hoc *, p<0.05). The mutant Jade-1S S18/20A.GFP cell line had a significantly lower percentage of cells in G2/M than the GFP.GFP control line (F) (F(2,4) = 16.97, p = 0.0111; Tukey's post hoc **, p < 0.01). G) The ratio of percentage cells in G2/M to S-phase was significantly increased in cells expressing Jade-1S S18/20A.GFP (F(2,4) = 8.497, p = 0.0363; Tukey's post hoc *, p < 0.05). Errors bars represent SEM.
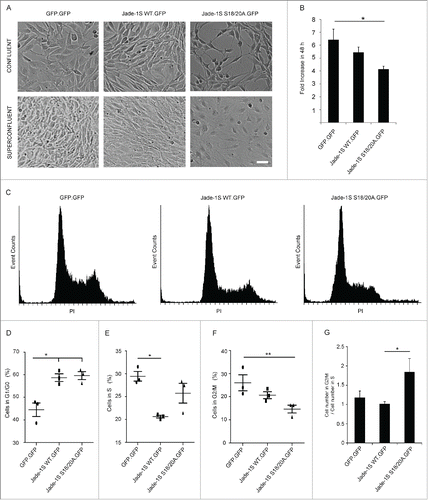
Figure 4. Identification of Jade-1S site S377 phosphorylated in the presence of over-expressed CK1α. A) MS2 spectrum demonstrating Serine 377 phosphorylation on the Jade-1S fragment 373-394. B) Quantitative phosphoproteomic analysis of Jade phosphorylation change in the absence and presence of CK1α in whole cells. The S377 site is marked by an asterisk. Only high-quality (class I) sites are shown, with all Jade-1S sites labeled accordingly. C) Schematic illustrating the amino acid sequences of the N-terminal CK1α phosphorylation site (S18/S20, underlined) corresponding to a putative Polobox-binding domain, and the C-terminal S377 motif corresponding to a PLK1 phosphorylation consensus motif. Green represents shared amino acid sequences while red represents those that differ (X = any amino acid; Φ = hydrophobic amino acid; p = phosphorylated). D and E) 293T cells were transiently transfected with constructs as indicated and processed as whole cell lysates 24 hours later. Expression of V5.Jade-1 was heavily modified by overexpressed F.PLK1 (D). This effect was not seen when V5.Jade-1 was over-expressed with a kinase-dead mutant of F.PLK1 (E). IB, immunoblot. WCL, whole cell lysate.
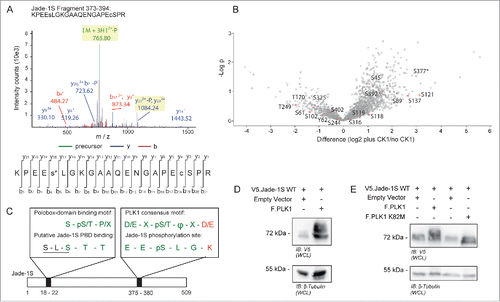
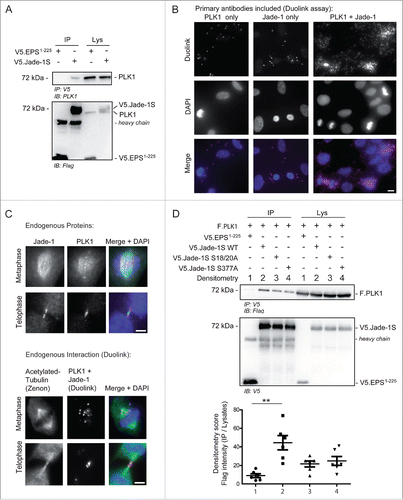
Figure 5. Endogenous Jade-1 and PLK1 interaction is dependent on a CK1α phosphorylation motif. A) 293T cells were transiently transfected with V5.Jade-1S or a control protein (V5.EPS1-225), harvested after 24 hours and the V5 tag was immuno-precipitated (IP). Endogenous PLK1 co-precipitated with V5.Jade-1S but not the control protein. B) RPE-1 cells grown on coverslips were PFA-fixed at 80% confluency. Endogenous PLK1 (left panel), endogenous Jade-1 (middle panel), or both (right panel) were immuno-labeled with appropriate primary antibodies and incubated with PLUS / MINUS PLA probes. The Duolink signal (magenta) labels interacting proteins and was increased from background when both Jade-1 and PLK1 primary antibodies were included, and further increased in mitotic cells. Merge with DAPI to label nuclei, scale bar = 10 µm. C) Comparison of co-localization (top panel set) vs. interaction (bottom panel set) of endogenous Jade-1 and PLK1 in metaphase and telophase. RPE-1 cells were grown to 80% confluency on coverslips and PFA-fixed. Cells were immuno-labeled with both anti-Jade-1 and anti-PLK1 antibodies and visualised using species-specific fluorescent secondary antibodies (top panel set; Jade-1 = green; PLK1 = magenta) or a Duolink PLA reaction (bottom panel set, magenta), in which case tubulin was subsequently co-labeled using a commercially available Zenon labeling kit (green). Both endogenous Jade-1 and PLK1 were visualised at the metaphase spindle and cytokinetic bridge (top panel). Interaction between Jade-1 and PLK1 was seen at the metaphase spindle and cytokinetic bridge (bottom panel). To allow for more specific vizualization of protein interaction, all background signal was virtually eliminated (see Methods). Merge with DAPI, scale bar = 5µm. D) 293T cells were transiently transfected with constructs as indicated for 24 hours. Co-precipitation of F.PLK1 with mutant V5.Jade-1S constructs lacking either the N-terminal CK1α phosphorylation site (Jade-1S S18/20A) or lacking the S377 putative PLK1-phosphorylation site (Jade-1S S377A) was reduced compared to co-precipitation with wild-type V5.Jade-1S (Jade-1 WT). Densitometry analysis (bottom panel) showed that F.PLK1 co-precipitation was significantly elevated from that obtained using a control protein (V5.EPS1-225) only with Jade-1 WT and not either of the mutants (F(3,15) = 6.736, p = 0.0043; Tukey's post hoc **, p < 0.01) IB, immunoblot. Lys, IP lysates.