3,461
Views
33
CrossRef citations to date
0
Altmetric
Report

Structure of the human dimeric ATM kinase

, , , , &
Pages 1117-1124 | Received 23 Nov 2015, Accepted 18 Feb 2016, Published online: 20 Apr 2016

Figures & data

Figure 1. Specimen preparation and EM imaging. (A) Silver-stained SDS-PAGE gel of human ATM purified from 293T cells. (B) Representative negative-stain EM micrograph of purified human ATM. Examples of individual ATM monomers and dimers particles are boxed in white and black, respectively.
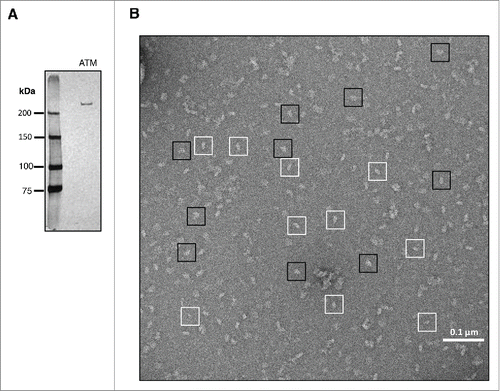
Figure 1. Specimen preparation and EM imaging. (A) Silver-stained SDS-PAGE gel of human ATM purified from 293T cells. (B) Representative negative-stain EM micrograph of purified human ATM. Examples of individual ATM monomers and dimers particles are boxed in white and black, respectively.

Figure 2. 2D image processing. (A) Examples of individual boxed-out raw particles. (B) Reference-free class averages of ATM monomer. (C) Comparison between representative map projections of ATM dimer (i) and their corresponding reference-free class averages (ii) in the same orientations.
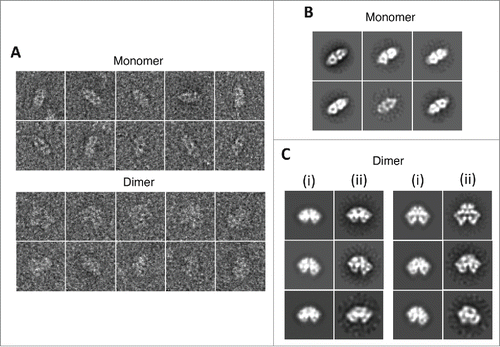
Figure 2. 2D image processing. (A) Examples of individual boxed-out raw particles. (B) Reference-free class averages of ATM monomer. (C) Comparison between representative map projections of ATM dimer (i) and their corresponding reference-free class averages (ii) in the same orientations.

Figure 3. 3D reconstruction. (A) Resolution estimation for the 3D reconstructions by the gold-standard Fourier shell correlation (FSC) plot. (B) Euler angle distribution plots showing the asymmetric unit for the 3D reconstruction. The height of the bar is proportional to the number of particles assigned to that projection. Note that the ATM dimer structure was reconstructed with C2 symmetry imposed.
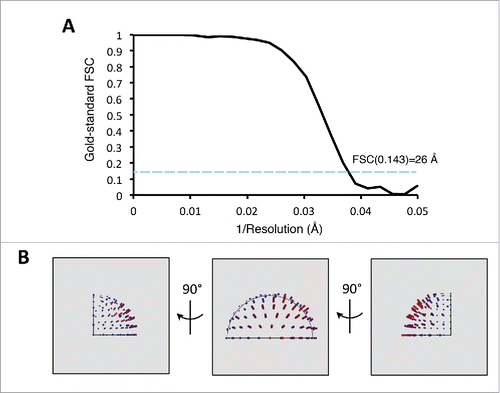
Figure 3. 3D reconstruction. (A) Resolution estimation for the 3D reconstructions by the gold-standard Fourier shell correlation (FSC) plot. (B) Euler angle distribution plots showing the asymmetric unit for the 3D reconstruction. The height of the bar is proportional to the number of particles assigned to that projection. Note that the ATM dimer structure was reconstructed with C2 symmetry imposed.

Figure 4. Overall structure of ATM dimer, volume segmentation and rigid-body fitting of atomic model into the EM map revealing the location of the N-terminal and the C-terminal regions. (A) EM map of the dimeric ATM in different views. The 2-fold symmetry axis is indicated with an oval. Scale bar represents 25 Å. (B) Reference-free class average showing the end-on view of the ATM dimer. The C-terminal FAT/kinase/FATC region within one of the monomers is outlined. (C) Left, volume segmentation of the EM map. The two monomers are distinguished by different colors (yellow and blue). The C-terminal FAT/kinase/FATC region on one of the monomers is displayed in semi-transparent pink with the crystal structure of the N-terminally truncated mTOR (PDB ID 4JSV) docked in. Right, blown-up view showing the fit between the mTOR crystal structure and the corresponding map segment. The viewing direction is indicated on the left with an arrow. The domain structures of ATM and mTOR in schematic representation are included. ATM: FAT domain (˜1966–2566), kinase domain (2614–2960), FATC domain (3025–3056). mTOR: FAT domain (˜1385–2002), kinase domain (2003–2450), FATC domain (2518–2549). The domains of the crystal structure are colored according to the schematic representation. The region consisting of residues 2021–2118 (FRB domain; light green) is removed from the crystal structure since this insertion region is not conserved in ATM.
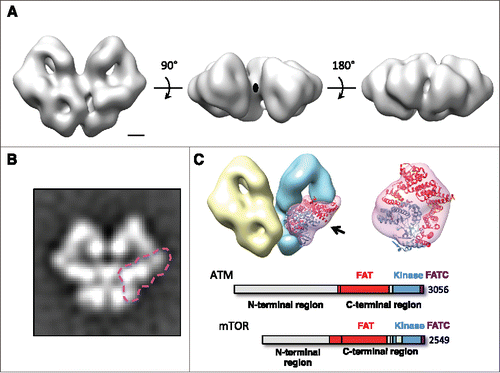
Figure 4. Overall structure of ATM dimer, volume segmentation and rigid-body fitting of atomic model into the EM map revealing the location of the N-terminal and the C-terminal regions. (A) EM map of the dimeric ATM in different views. The 2-fold symmetry axis is indicated with an oval. Scale bar represents 25 Å. (B) Reference-free class average showing the end-on view of the ATM dimer. The C-terminal FAT/kinase/FATC region within one of the monomers is outlined. (C) Left, volume segmentation of the EM map. The two monomers are distinguished by different colors (yellow and blue). The C-terminal FAT/kinase/FATC region on one of the monomers is displayed in semi-transparent pink with the crystal structure of the N-terminally truncated mTOR (PDB ID 4JSV) docked in. Right, blown-up view showing the fit between the mTOR crystal structure and the corresponding map segment. The viewing direction is indicated on the left with an arrow. The domain structures of ATM and mTOR in schematic representation are included. ATM: FAT domain (˜1966–2566), kinase domain (2614–2960), FATC domain (3025–3056). mTOR: FAT domain (˜1385–2002), kinase domain (2003–2450), FATC domain (2518–2549). The domains of the crystal structure are colored according to the schematic representation. The region consisting of residues 2021–2118 (FRB domain; light green) is removed from the crystal structure since this insertion region is not conserved in ATM.

Figure 5. Intersubunit interaction and proposed mechanism of kinase activity inhibition. The N-terminal regions comprising of HEAT repeats are represented in solid surface. The head and the tail domains of the N-terminal region are labeled. The domains of the mTOR crystal structure are colored according to the schematic representation in . The EM map is represented in semi-transparent gray surface. The kinase activity center is indicated with an asterisk. Bottom left, the distance between the tail domain and the active site is ˜10 Å. Bottom right, similar restriction of the active-site cleft due to the presence of mLST8 (yellow), the FRB insertion (brown) and FKBP-rapamycin in mTOR. The RNC domain of Raptor is omitted for clarity.
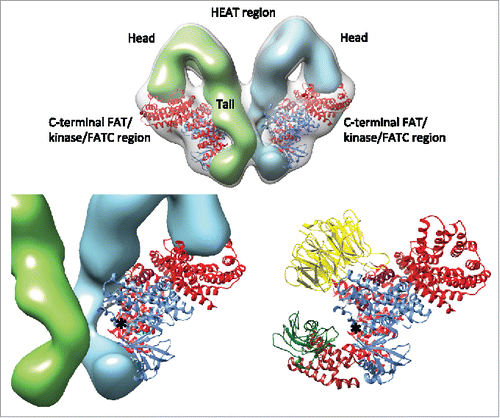
Figure 5. Intersubunit interaction and proposed mechanism of kinase activity inhibition. The N-terminal regions comprising of HEAT repeats are represented in solid surface. The head and the tail domains of the N-terminal region are labeled. The domains of the mTOR crystal structure are colored according to the schematic representation in Fig. 4C. The EM map is represented in semi-transparent gray surface. The kinase activity center is indicated with an asterisk. Bottom left, the distance between the tail domain and the active site is ˜10 Å. Bottom right, similar restriction of the active-site cleft due to the presence of mLST8 (yellow), the FRB insertion (brown) and FKBP-rapamycin in mTOR. The RNC domain of Raptor is omitted for clarity.

Figure 6. Localization of the C2991 residue in ATM necessary for activation via the oxidative mechanism. The top portion of the map is removed for clarity. The locations of the variable loop consisting of residues 2437–2491, which is disordered in the crystal structure, are indicated with asterisks. This loop region contains the critical residue C2991 in the corresponding ATM structure that is essential for its oxidation activation. The domains of the mTOR crystal structure are colored according to the schematic representation in .
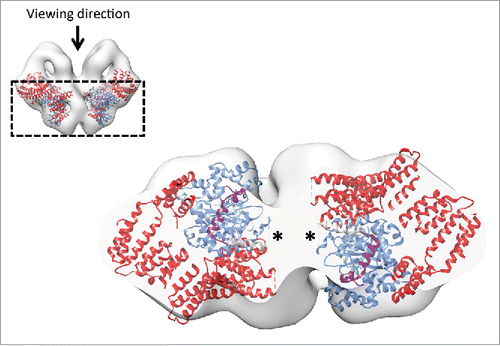
Figure 6. Localization of the C2991 residue in ATM necessary for activation via the oxidative mechanism. The top portion of the map is removed for clarity. The locations of the variable loop consisting of residues 2437–2491, which is disordered in the crystal structure, are indicated with asterisks. This loop region contains the critical residue C2991 in the corresponding ATM structure that is essential for its oxidation activation. The domains of the mTOR crystal structure are colored according to the schematic representation in Fig. 4C.