Figures & data
Figure 1. FANCI interacted with PHLPP1 and Akt. (A) Immunoblots of WCL and reciprocal co-immunoprecipitations (co-IPs) in which the indicated tagged PHLPP1 or FANCI interacted with endogenous FANCI or PHLPP1. GAPDH indicates a loading control. Whole cell lysates (WCL) and immunoprecipitations were derived from HEK293 cells transfected with the indicated Flag, HA (hemagglutinin) or Myc tagged constructs. (B) Immunoblots of WCL and reciprocal co-IPs showing FANCI interacted with Akt. (C) Depletion of PHLPP1 indicated it is not required for interaction between FANCI and Akt. Immunoblots of WCL and co-IP of Akt with FANCI and PHLPP1. (D) Akt interacted with FANCD2 and USP1. Immunoblots of WCL and co-IP of HA-Akt with FANCD2 and USP1. (E) Immunoblots of WCL and co-IP showing FANCI interacted with PHLPP2. (F) FANCI interacted with Akt in vitro. Immunoblot of a pull-down assay with affinity purified HA-Akt and Flag-FANCI. Eluate refers to HA-Akt eluted from beads prior to addition to Flag-FANCI beads.
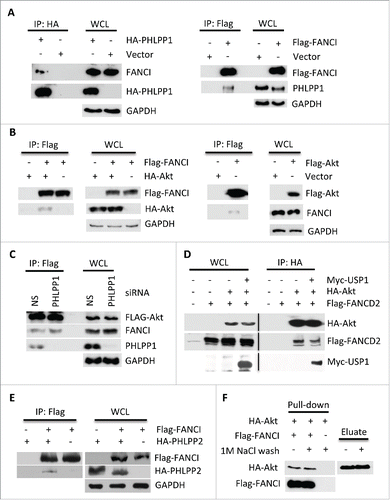
Figure 2. Depletion of FANCI by siRNA induced spontaneous phosphorylation of Akt at S473 and T308. (A-F) Immunoblots of Akt, GSK-3β and FoxO in human nontransformed and cancer cell lines upon FANCI depletion. FANCI-1, FANCI-2, PHLPP1-1 and PHLPP1-2 indicate distinct siRNAs. NS indicates a control siRNA. GAPDH indicates a loading control.
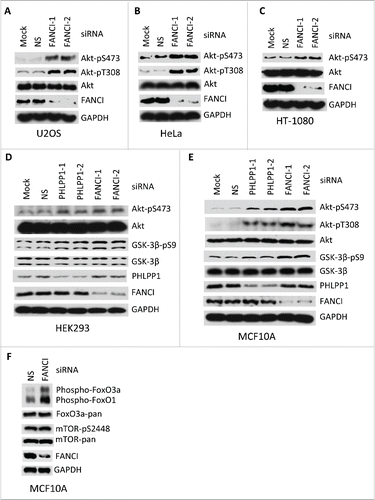
Figure 3. DNA damage promoted Akt activation through disruption of the PAF complex. (A) Depletion of FANCI by siRNA decreased the interaction between Akt and PHLPP1. Immunoblots of WCL and reciprocal co-IPs between Flag-Akt and HA-PHLPP1 upon depletion of FANCI. GAPDH indicate loading controls. WCL and immunoprecipitations were derived from HEK293 cells transfected with the indicated Flag or HA tagged constructs. (B-D) UV irradiation disrupted components of the PAF complex. Immunoblots of WCL and co-IPs of Flag-FANCI, HA-Akt, and HA-PHLPP1 as indicated. E, Effects of MMC treatment and recovery on Akt-FANCI interaction and Akt phosphorylation in either HEK293 or U2OS cells transfected with the indicated constructs. Immunoblots of WCL and co-IPs of Flag-Akt and HA-FANCI. “MMC 16 hrs” indicates exposure of cells to the drug for 16 hours; “Six hrs recovery” indicates a subsequent 6 hours of incubation in normal media. GAPDH and CDC5 indicate loading controls.
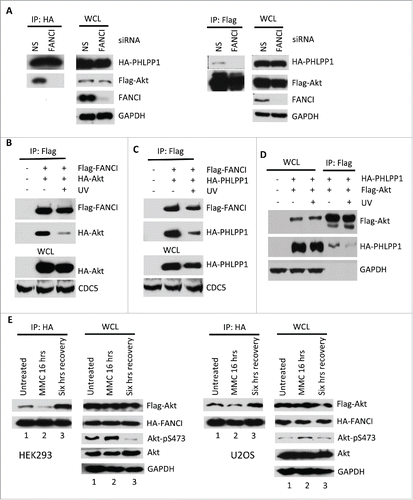
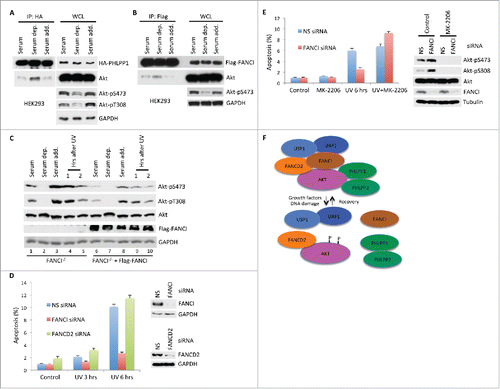
Figure 4. Serum levels regulated the PAF complex and Akt activation. (A) Immunoblots of WCL and co-IPs between HA-PHLPP1 and Akt after 6 hours of serum deprivation followed by 30 minutes of recovery in normal medium. WCL and immunoprecipitations were derived from either HEK293 or HeLa cells transfected with the indicated Flag or HA tagged constructs. GAPDH indicates a loading control. (B) Immunoblots of WCL and co-IPs between Flag-FANCI and Akt after serum deprivation and recovery in normal medium. (C) Phosphorylation of Akt is differentially affected by serum levels or DNA damage in HeLa FANCI−/− cells compared to cells rescued with Flag-FANCI. Immunoblots of WCL after serum deprivation and recovery in normal medium, or upon treatment with UV irradiation. (D) Depletion of FANCI, but not FANCD2, reduced DNA damage induced apoptosis. Left panel, Annexin V assays showing levels of apoptosis after UV irradiation in MCF10A cells depleted of indicated FANC proteins. “UV 3 hrs” indicates cells were processed for analysis 3 hours after exposure to UV irradiation. Experiments were performed in triplicate; data are shown as mean ± s.d. Right panel, immunoblots showing depletion of FANC proteins by siRNA. (E) Inhibition of Akt restored apoptosis in FANCI depleted cells. Left panel, apoptosis assays were performed as indicated in D with the Akt inhibitor MK-2206. Right panel, immunoblots showing depletion of FANCI and phosphorylation status of Akt. Tubulin indicates a loading control. (F) Schematic indicating the structure of the known components of the PAF complex and its responses to DNA growth factor stimulation or DNA damage, and its response to recovery from these stimuli. “P” indicates phosphorylation sites on Akt at S473 and S308.