Figures & data
Figure 1. Viability of human and mouse cardiosphere-derived cells (CDCs) post mortem. Human heart and mouse cadaver tissue were plated at 4° C, and removed at different time points for HE staining and for culturing CDCs. Hearts of mice were fixed with 4% paraformaldehyde, and then were paraffin-embedded and cut transversely into sections. These sections were stained with hematoxylin and eosin (HE). (A-D) Representative images of CLH-EDCs (A) and CM-EDCs (C) after 8 d in culture, and representative HE staining images of human (B) and mouse (D) heart (C scale bar = 50 µm; A, B, D scale bar = 100 µm). (E and F) Representative CM-EDCs (E) and CLH-EDCs (F) were harvested from autopsy specimens on one plate. (G and H) Representative time of CM-EDCs (G) and CLH-EDCs (H) growth from autopsy specimens. (I and J) Representative proliferation of CM-EDCs (I) and CM-CDCs (J) were determined by CCK-8 every 2 d for 9 d.
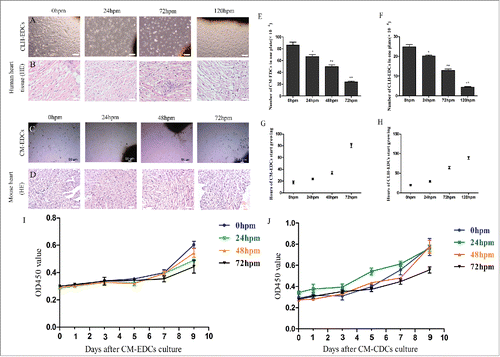
Figure 2. Characteristics of CDCs derived from mouse and human. (A) CD117 expression in CM-CDCs was assessed by flow cytometry and shown in a representative figure. (B) Representative summary of the antigenic phenotype of CM-CDCs. (C) Representative summary of the antigenic phenotype of CLH-EDCs. Data are shown as the mean ± SEM of 3 independent experiments. *p < 0.05 vs. 0 h group, **p < 0.01 vs. 0 h group.
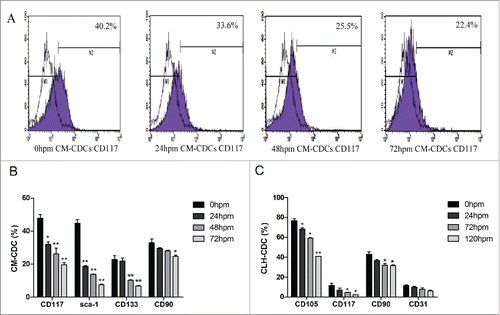
Figure 3. Comparison of transcription factors from human and mouse CDCs. Protein expression of GATA-4 and Nkx2.5 was measured by immunofluorescence and quantified by RT-PCR. (A-H) Human cardiospheres post mortem express GATA-4 and Nkx2.5 by immunofluorescence. (I and J) CLH-EDCs post mortem express GATA-4 and Nkx2.5 by immunofluorescence. Nuclei were counterstained with DAPI (blue) and cell positive in green. (K and L) CLH-EDCs post mortem express GATA-4 and Nkx2.5 by RT-PCR. Data are shown as the mean ± SEM of 3 independent experiments. (A-H. Scale bar = 100 µm, I-J. Scale bar = 50 µm) *p < 0.05 vs. 0 h group, **p < 0.01 vs. 0 h group.
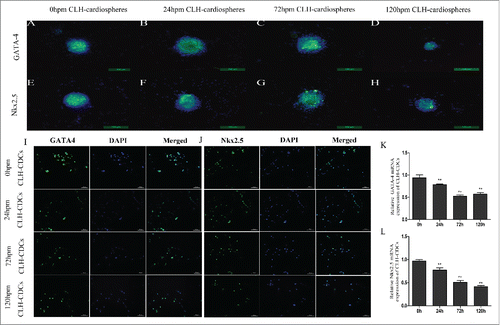
Figure 4. CLH-EDCs post mortem maintain their differentiation ability. We examined differentiation of CLH-EDCs post mortem by immunofluorescence and quantified by RT-PCR. (A) CLH-EDCs post mortem express TNI, VWF, and SMA by immunofluorescence. Nuclei were counterstained with DAPI (blue) and cell positive in green. (B-D) Quantitation of TNI, VWF, and SMA mRNA levels by RT-PCR. Scale bar = 100 µm. Data are shown as the mean ± SEM of 3 independent experiments. *p < 0.05 vs. 0 h group, **p < 0.01 vs. 0 h group.
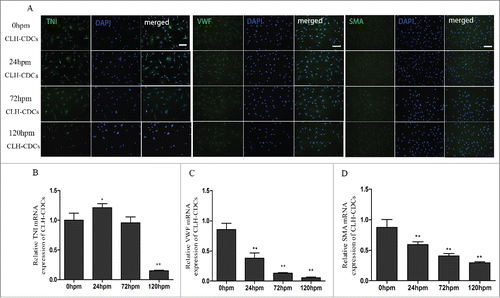
Figure 5. CLH-EDCs post mortem have paracrine function. The comparison of cytokine profile secreted by CLH-EDCs. (A-C) Cytokines (VEGF, IGF-1, HGF) were analyzed by ELISA. Data are shown as the mean ± SEM of 3 independent experiments.*p < 0.05 vs. 0 h group.
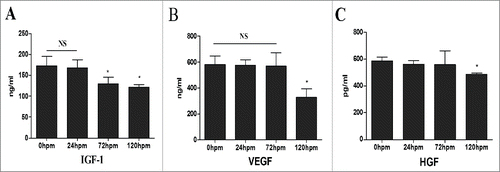
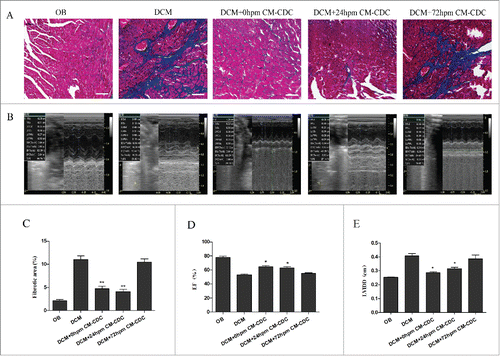
Figure 6. CDCs transplantation reduce collagen mass and improve cardiac function. (A) Masson's trichrome staining for cardiac fibrosis evaluation. (B) Representative images of LV M-mode echocardiograms 8 weeks after CM-CDCs transplantation. (D and E) Changes in ejection fraction (EF) and LV internal diastolic diameter (LVIDD) after CM-CDCs or PBS treatment, n = 10 in PBS groups, n = 8 in CM-CDCs-treated groups. Scale bar = 50 µm. Data are shown as the mean ± SEM. *p < 0.05 vs. DCM+PBS treated group. (C) Myocardial fibrosis was evidently reduced in the 0 h CM-CDC-treated and 24 h CM-CDC-treated groups compared to the PBS-treated group; however, fibrosis in the 72 h CM-CDC-treated mice was similar to that in the PBS-treated mice.