Figures & data
Figure 1. A) Azurin alters adhesion of A549 lung cancer cells to some extracellular matrix (ECM) components. Azurin treatment (50 µM and 100 µM, 48h) caused a reduction in the percentage of adhesion of cells to laminin-332, fibronectin and collagen type-I and IV (adhesion time = 20 min; * p < 0.05). B) A single treatment with azurin at 100 µM for 48h (same conditions as for adhesion assays) reduces protein expression of integrin subunit β1 under normal plastic conditions (black bars), or a matrix formed by collagen type-I (white bars) in A549 lung cancer cells. In contrary, these cells exhibit higher levels of E-cadherin under the same conditions. In the right panel, results are presented as the ratio of band intensity of target protein between azurin treated samples and control samples, both normalized to their respective actin band intensity (* p < 0.05). C) Immunofluorescence staining of integrin β1 (green, upper panel) and E-cadherin (green, lower panel) under the same treatment conditions (nuclei – DAPI, blue). Treatment with azurin alters the normal membrane staining of this transmembrane protein causing a delocalozation to a diffuse pattern in the interior of cells; D) Co-immunoprecipitation of ubiquitin and integrin β1. An antibody to this integrin was incubated with total cell lysates and used to precipitate it from both control and azurin treated total cell lysates. Proteins were separated in SDS-Page gels transferred to membranes which were probed with anti-ubiquitin antibody. A band corresponding to ubiquitin was detected at the molecular weight correspondent to integrin β1.
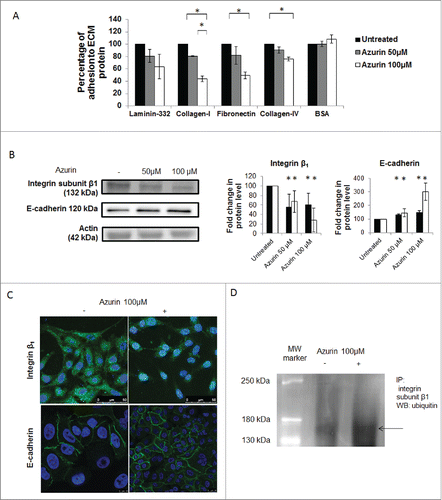
Figure 2. Azurin decreases invasion of A549 cells. Matrigel Invasion Assays showed that a single treatment with azurin 100 µM for 48 h significantly reduced the invasive behavior of breast cancer cells in Transwell assays (* p < 0.05).
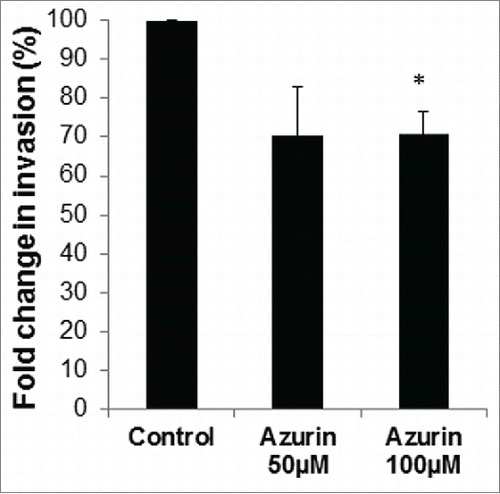
Figure 3. Effect of azurin in PI3K, Akt and Src signaling. Azurin at 50 µM and 100 µM decreased phosphorylation levels of pPI3K, pAkt and pSrc in both A549 cells. Total PI3K, Akt and Src levels were also analyzed. Results are presented as the ratio of band intensity of target protein between azurin treated samples and control samples, both normalized to their respective GAPDH band intensity (* p < 0.05).
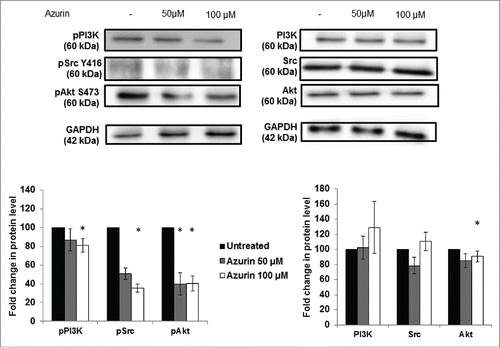
Figure 4. (A) Effect of azurin in EGFR signaling. Azurin at 50 µM and 100 µM decreased phosphorylation levels of pEGFR in both A549 cells. Total EGFR levels were also analyzed. Results are presented as the ratio of band intensity of target protein between azurin treated samples and control samples, both normalized to their respective actin band intensity (* p < 0.05) (upper panel); Azurin internalization impairs proper pEGFR response to soluble EGF. Cells were serum starved for 24h, pre-treated with azurin (100 µM, 48h) and treated with EGF (20 or 50 ng/ml) for 30 min. EGF-dependent signaling was evaluated in western blot with pEGFR Y1068 antibody. Results are presented as the ratio of band intensity of target protein between azurin-treated samples and control samples, both normalized to their respective GAPDH band intensity (* p < 0.05). B) Azurin potentiates the effects of gefitinib. 4 × 10³ cells per well were plated in 96-well plates and left to adhere overnight. In the next day, cells were treated with either azurin (25, 50 or 100 µM), gefitinib (0.01, 0.1 or 1 µM) or a combination of both. After 72h, cell proliferation was determined by MTT assay. Results are expressed as percentage of cell death relative to the control (untreated cells). Values are presented as mean ± SD. White bars represent cell treated with azurin only, gray bars represent cells treated with gefitinib only, and dark gray bars represent cells treated with both agents. The asterisks over each bar represent statistical significance related to untreated cells; the asterisks over a line connecting 2 bars represent statistical significance between those 2 conditions (* p < 0.05). C) Azurin potentiates the effects of erlotinib. 4 × 10³ cells per well were plated in 96-well plates and left to adhere overnight. In the next day, cells were treated with either azurin (100 µM), erlotinib (1 µM) or a combination of both. After 72h, cell proliferation was determined by MTT assay. Results are expressed as percentage of cell death relative to the control (untreated cells). Values are presented as mean ± SD. White bars represent cell treated with azurin only, gray bars represent cells treated with erlotinib only, and dark gray bars represent cells treated with both agents. The asterisks over each bar represent statistical significance related to untreated cells; the asterisks over a line connecting 2 bars represent statistical significance between those 2 conditions (* p < 0.05).
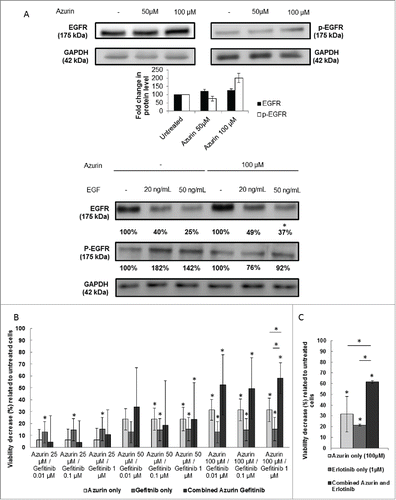
Figure 5. A) Representative height (upper panel) and error (lower panel) AFM images of A549 cells untreated (control), or treated with azurin (100 µM, 48h), gefitinib (1 µM, 72h) or both (same concentrations, 72h). B ) Morphological characteristics (cell area, height and volume) of A549 cells at the same conditions. Values are presented as mean ± SEM. * p < 0.05; ** p < 0.01; *** p < 0.001.
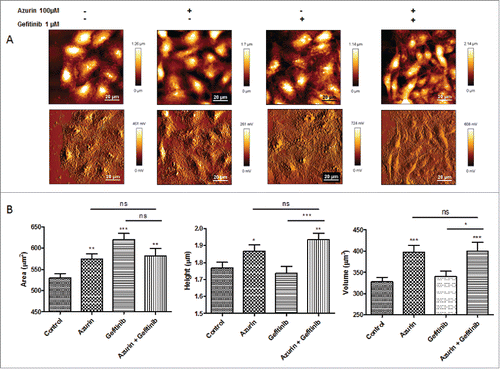
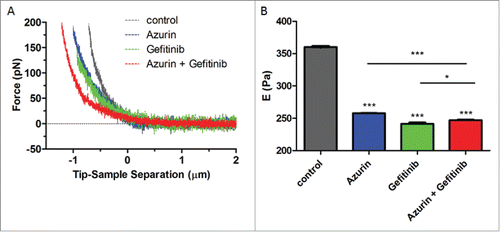
Figure 6. (A) Force indentation curves obtained from indentation of A549 cells untreated (control), or treated with azurin (100 µM, 48h), gefitinib (1 µM, 72h) or both (same concentrations, 72h); (B) Young's modulus for A549 cells untreated (control), or treated with azurin (100 µM, 48h), gefitinib (1 µM, 72h) or both (same concentrations, 72h). Results with standard deviations were obtained by using over 250 cells, in at least 3 different biological replicates, with 5 force curves per cell. Values are presented as the maximum Gaussian mean ± SEM. * p = 0.015; *** p < 0.001.