1,754
Views
3
CrossRef citations to date
0
Altmetric
Reports

Quantitative assessment of chromosome instability induced through chemical disruption of mitotic progression

, , , &
Pages 1706-1714 | Received 01 Feb 2016, Accepted 02 Apr 2016, Published online: 26 May 2016

Figures & data

Figure 1. Isolation of the U2OS-Phoenix cell line. (a) Cartoon depicting fusion constructs that were introduced into the LoxP site of the AlphoidtetO HAC backbone as markers of CIN within one cell division. N terminal aa 1–99 of hSecurin was fused with tandem copies of enhanced Green Fluorescent Protein (eGFP). Also shown is E. coli tet repressor TetR fused with mCherry (For more details see Materials and Methods). (b) Schematic representation of the HAC containing the constructs with their position and orientation within the HAC (bsr: gene conferring Blasticidin resistance, for more details about HAC construction refer to papers 20 and 21, for more details about loading of the targeting construct into the HAC see Materials and methods). (c) FISH using the FITC-tetO PNA probe detecting the newly constructed HAC in the CHO and U2OS cells. CHO cells containing AlphoidtetO HAC was used as a control. Chromosomes are counterstained with DAPI (blue). Arrows indicate HACs. In the insert, HACs are shown in higher magnification. Size bars = 15 μm.
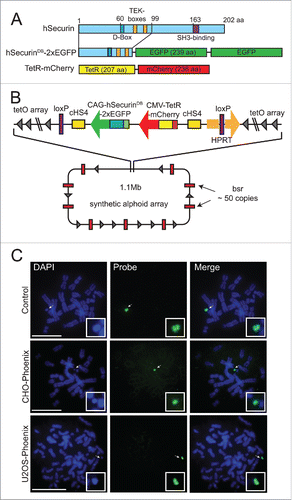
Figure 1. Isolation of the U2OS-Phoenix cell line. (a) Cartoon depicting fusion constructs that were introduced into the LoxP site of the AlphoidtetO HAC backbone as markers of CIN within one cell division. N terminal aa 1–99 of hSecurin was fused with tandem copies of enhanced Green Fluorescent Protein (eGFP). Also shown is E. coli tet repressor TetR fused with mCherry (For more details see Materials and Methods). (b) Schematic representation of the HAC containing the constructs with their position and orientation within the HAC (bsr: gene conferring Blasticidin resistance, for more details about HAC construction refer to papers 20 and 21, for more details about loading of the targeting construct into the HAC see Materials and methods). (c) FISH using the FITC-tetO PNA probe detecting the newly constructed HAC in the CHO and U2OS cells. CHO cells containing AlphoidtetO HAC was used as a control. Chromosomes are counterstained with DAPI (blue). Arrows indicate HACs. In the insert, HACs are shown in higher magnification. Size bars = 15 μm.

Figure 2. GFP expression in U2OS-Phoenix cells is coupled to the cell cycle. (a) Cartoon depicting U2OS-Phoenix cells undergoing one round of error free mitosis. At the onset of anaphase, active APC/C-cdc20 recognizes and ubiquitinates DB-containing proteins promoting their degradation. Thus, hSecurinDB-2xeGFP fusions expressed from HACs are rapidly degraded at the onset of anaphase, and re-accumulate in the 2 daughter cells after G1 phase. (b) Still images from a live cell imaging experiment following hSecurinDB-2xGFP and TetR-mCherry signals in U2OS-Phoenix cells using a spinning disc confocal microscope. The images follow one cell in 2 rounds of consecutive mitosis. The GFP levels in the imaged cell and its daughter are coupled to the cell cycle. Size bars = 30 μm (c) The mean fluorescent intensity of the GFP signal was quantified in 10 cells from movies such as in (b) and plotted against time.
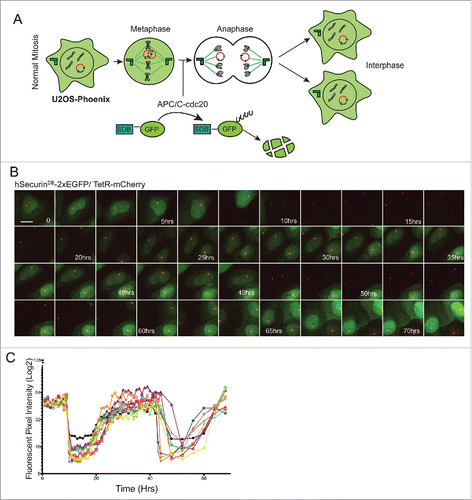
Figure 2. GFP expression in U2OS-Phoenix cells is coupled to the cell cycle. (a) Cartoon depicting U2OS-Phoenix cells undergoing one round of error free mitosis. At the onset of anaphase, active APC/C-cdc20 recognizes and ubiquitinates DB-containing proteins promoting their degradation. Thus, hSecurinDB-2xeGFP fusions expressed from HACs are rapidly degraded at the onset of anaphase, and re-accumulate in the 2 daughter cells after G1 phase. (b) Still images from a live cell imaging experiment following hSecurinDB-2xGFP and TetR-mCherry signals in U2OS-Phoenix cells using a spinning disc confocal microscope. The images follow one cell in 2 rounds of consecutive mitosis. The GFP levels in the imaged cell and its daughter are coupled to the cell cycle. Size bars = 30 μm (c) The mean fluorescent intensity of the GFP signal was quantified in 10 cells from movies such as in (b) and plotted against time.

Figure 3. The rate of HAC missegregation in U2OS-Phoenix is comparable to endogenous chromosomes. (a) Images of U2OS-Phoenix cells at anaphase showing events of lagging chromosomes, chromosome bridges, and HAC missegregation. Unsynchronized cells were fixed and DAPI stained and data was collected using a fluorescent microscope. Size bars = 30 μm. (b) Pie graphs showing percentage of U2OS-Phoenix cells with either lagging chromosomes and bridges, HAC missegregation, multipolar spindles or micronuclei. (1 23 events in 417 anaphases;2 1 event in 341 anaphases;3 2 events in 417 anaphases;4 69 (1) and 14 (≥ 2) in 1395 interphases counted). No HACS were observed in micronuclei.
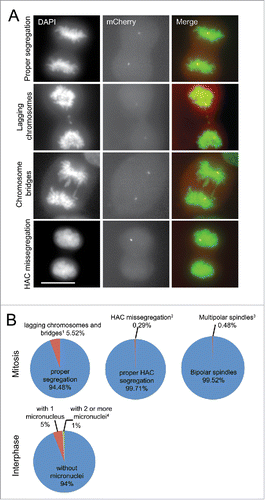
Figure 3. The rate of HAC missegregation in U2OS-Phoenix is comparable to endogenous chromosomes. (a) Images of U2OS-Phoenix cells at anaphase showing events of lagging chromosomes, chromosome bridges, and HAC missegregation. Unsynchronized cells were fixed and DAPI stained and data was collected using a fluorescent microscope. Size bars = 30 μm. (b) Pie graphs showing percentage of U2OS-Phoenix cells with either lagging chromosomes and bridges, HAC missegregation, multipolar spindles or micronuclei. (1 23 events in 417 anaphases;2 1 event in 341 anaphases;3 2 events in 417 anaphases;4 69 (1) and 14 (≥ 2) in 1395 interphases counted). No HACS were observed in micronuclei.

Figure 4. Increased levels of HAC mis-segregation upon treatment with chemotherapeutic agents. (a) Still images from live cell imaging experiments of U2OS-Phoenix cells showing examples of proper HAC segregation in control and examples of HAC missegregation in various treatments. TetR-mCherry and hSecurinDB-2xGFP signals were followed using a spinning disk confocal microscope. The daughter cells of a mother cell that undergoes a HAC missegregation event have either 2 HACs (GFP positive) or no HAC (GFP negative) and survive for over 20hrs in case of Nocodazole and Reversine treatments. The daughter cells were DAPI stained at the end of the movie to visualize the ones that do not carry a HAC. Size bars = 30 μm. (b-e) Bar graphs depicting percentage of U2OS-Phoenix cells that missegregate the HAC (ncontrol=195; nNocodazole=111; nTaxol=67; nReversine=111) (b), undergo multipolar division (ncontrol=196; nNocodazole=114; nTaxol=96; nReversine=117) (c), undergo mitotic catastrophe (ncontrol=197; nNocodazole=121; nTaxol=97; nReversine=117) (d), and have problems in cytokinesis (ncontrol=196; nNocodazole=114; nTaxol=96; nReversine=117) (e) quantified from live cell imaging experiments (***p<0 .001, **p≤0 .01, *p<0 .05). Multipolar divisions were omitted from HAC missegregation counts.
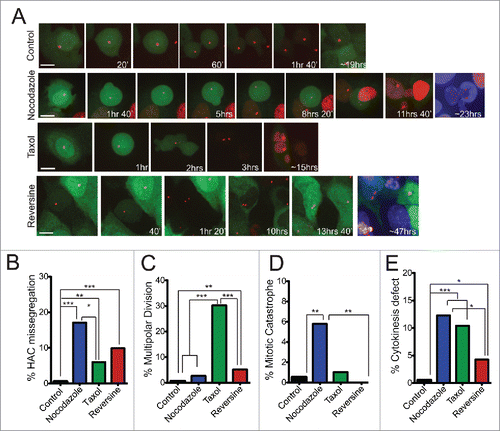
Figure 4. Increased levels of HAC mis-segregation upon treatment with chemotherapeutic agents. (a) Still images from live cell imaging experiments of U2OS-Phoenix cells showing examples of proper HAC segregation in control and examples of HAC missegregation in various treatments. TetR-mCherry and hSecurinDB-2xGFP signals were followed using a spinning disk confocal microscope. The daughter cells of a mother cell that undergoes a HAC missegregation event have either 2 HACs (GFP positive) or no HAC (GFP negative) and survive for over 20hrs in case of Nocodazole and Reversine treatments. The daughter cells were DAPI stained at the end of the movie to visualize the ones that do not carry a HAC. Size bars = 30 μm. (b-e) Bar graphs depicting percentage of U2OS-Phoenix cells that missegregate the HAC (ncontrol=195; nNocodazole=111; nTaxol=67; nReversine=111) (b), undergo multipolar division (ncontrol=196; nNocodazole=114; nTaxol=96; nReversine=117) (c), undergo mitotic catastrophe (ncontrol=197; nNocodazole=121; nTaxol=97; nReversine=117) (d), and have problems in cytokinesis (ncontrol=196; nNocodazole=114; nTaxol=96; nReversine=117) (e) quantified from live cell imaging experiments (***p<0 .001, **p≤0 .01, *p<0 .05). Multipolar divisions were omitted from HAC missegregation counts.
Supplemental material

Supplemental Files

Download MS Word (756.9 KB)