Figures & data
Figure 1. Proliferation alteration mediated by PKD3 deficiency and its sub cellular localization during mitosis: (A) MEFs were seeded out at day 0 and cell numbers were counted each day for 6–8 days after seeding. Left graph indicates proliferation rates of primary wild type (blue) and PKD3 deficient (green) MEFs. Right graph indicates proliferation rates of immortalized wild type (blue), PKD3 deficient (green), wild type + exogenously expressing PKD.DN construct (purple) and PKD3 deficient + exogenously expressing PKD3 construct (orange) MEFs. PKD3 deficiency and expression of exogenous expressed proteins was verified by western blotting (data not shown). Quantitative results (means +/− SD of triplicates) are shown. (B) PKD3/GFP localization during mitosis was analyzed by immunofluorescence. Individual stages of mitosis (indicated on the left) were estimated by DAPI staining (1st column). 2nd column shows the corresponding PKD3/GFP signal followed by α/β tubulin antibody staining for verification of mitotic structures. Merge of the PKD3/GFP and α/β tubulin signal and a complete merge are shown in the last two columns. Expression of the PKD3/GFP construct was verified by protein gel blot (data not shown), all images are representative for each stage and applied staining. Scale bars: 48 μM.
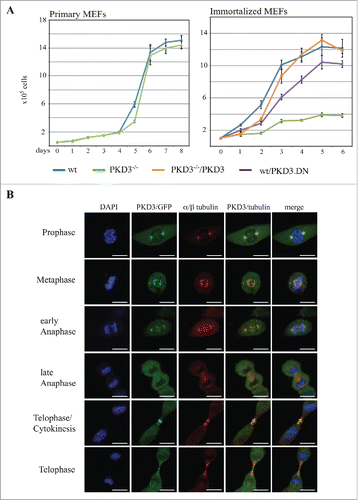
Figure 2. Propidium iodide (PI) based analysis of the cell cycle of wildtype and PKD3 deficient MEFs: (A) Wild type MEFs were seeded and starved for 24 h at 50% confluence followed by an incubation with aphidicoline for 24 h and released for another 12 h. Alternatively aphidicoline treated MEFs were incubated with RO-3306 for 24 h and released for 12 h or treated with nocodazole for 24 h before the release (16 h). Individual PI stainings of each step are shown, with each labeled on top of the graph. (B) PKD3 deficient MEFs were treated the same way and analyzed accordingly. (C) Detailed analysis of wild type and PKD3 deficient MEFs after nocodazole treatment. Individual steps are indicated on top of the graphs. For all assays, multiple independent experiments were performed which all showed similar results.
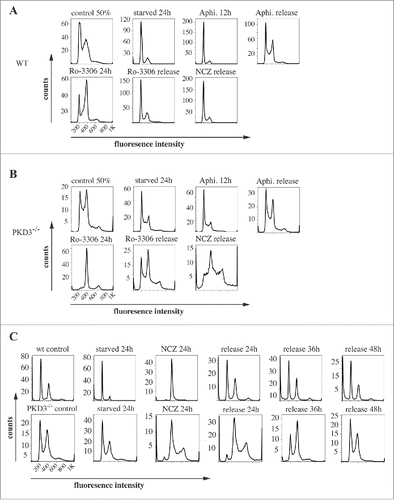
Figure 3. PKD3 deficiency induces alterations in microtubule dynamics after synchronization: Wild type and PKD3 deficient MEFs were starved for 24 h and treated with indicated inhibitors for another 24 h before release. PI stainings were performed for individual time points as indicated. (A) Wild type samples are shown. Single left graph indicates wt control before treatment followed by vincristine (top), colcemid (middle) and taxol (bottom) treated samples after starvation but before release, followed by graphs showing PI stainings after 24 h and 48 h release. (B) PKD3 deficient samples are shown. Single left graph indicates PKD3 deficient control before treatment followed by vincristine (top), colcemid (middle) and taxol (bottom) treated samples after starvation but before release, followed by graphs showing PI stainings after 24 h and 48 h release. For all assays, multiple independent experiments were performed which all showed similar results.
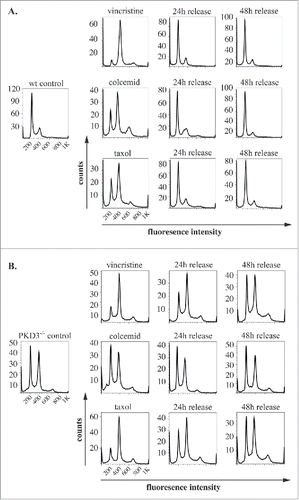
Figure 4. Failure in microtubule nucleation in PKD3 deficient MEFs: Wild type and PKD3 deficient MEFs were kept under normal cell culture conditions before fixation and incubation with indicated antibodies according to protocols described in material and methods. (A) α/β-tubulin antibody staining of wt (first three rows on the left) and PKD3−/− (last three rows on the right) MEFs at indicated mitotic phases (estimated by DAPI staining). (B) γ-tubulin antibody staining of wt (first three images on the left) and PKD3−/− (last three images on the right) MEFs at metaphase (estimated by DAPI staining). (C) First row: Wild type MEFs were treated with 50μM H2O2 for 15 min at 37°C before fixation and indicated staining or antibody incubation according to protocols described in material and methods. This sample served as control for the validation of cytoplasmic Cyt C release after apoptotic induction. Second row: Example of a PKD3 deficient MEF with appropriate aligned condensed chromosomes at prometaphase. Third row: Example of a PKD3 deficient MEF with improper aligned condensed chromosomes at prometaphase. Applied stainings and antibody are indicated above the images. Cyt C release into the cytoplasm (green color) indicates the induction of the apoptotic cascade. All images are representatives of many for the indicated staining. Scale bars: 48 μM.
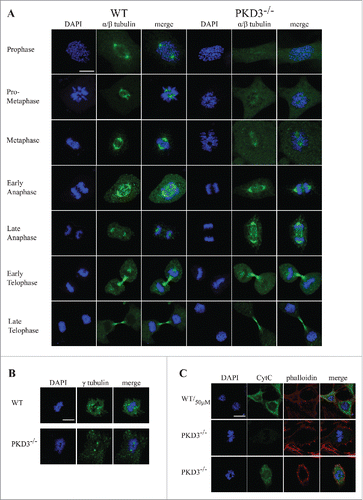
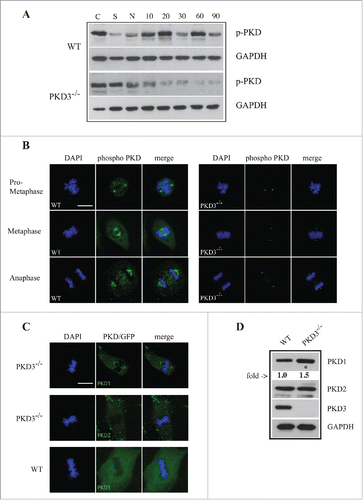
Figure 5. Analysis of PKD activity during the cell cycle: (A) Western blot analysis of wt and PKD3−/− cell extracts after starvation (S) for 24 h, nocodazole treatment (N) for 24 h and different time points after release (10, 20, 30, 60 and 90 min). Phospho-specific Ser738/742 PKD antibody was used to evaluate PKDs activity status. GAPDH antibody was applied as loading control. Shown results are representative of three independent experiments. (B) Wild type and PKD3 deficient MEFs were kept under normal cell culture conditions before fixation and incubation with the phospho-specific Ser738/742 PKD antibody according to protocols described in material and methods. Mitotic phases evaluated by DAPI staining are indicated on the left. First three rows on the left represent wt MEFs whereas last three rows on the right represent PKD3−/− MEFs. (C) Confocal images of PKD1/GFP expression (top lane) and PKD2/GFP expression (middle lane) in PKD3 deficient MEFs and PKD1/GFP expression in wt MEFs (bottom lane) at metaphase. Expression of individual PKD/GFP construct was verified by western blot (data not shown). All images are representatives of many for the indicated staining. Scale bars: 48 μM. (D) Western blot analysis of wt and PKD3−/− cell extracts. Applied antibodies are indicated on the right side. PKD1 showed a 1.5 fold increase in the PKD3 deficient extract while PKD2 showed no difference. No PKD3 was detectable in the deficient extract. GAPDH antibody was applied as loading control. For the image analysis ImageJ 1.47 v software was applied.