1,870
Views
18
CrossRef citations to date
0
Altmetric
Reports

DDB1 and CUL4 associated factor 11 (DCAF11) mediates degradation of Stem-loop binding protein at the end of S phase

, &
Pages 1986-1996 | Received 10 Feb 2016, Accepted 14 May 2016, Published online: 06 Jul 2016

Figures & data

Figure 1. Experimental setup for pull-downs. (A) Amino acid sequence of SLBP fragment, sufficient to mediate S/G2 degration of SLBP. All the possible phosphoacceptor sites other than Thr 60 and Thr 61 were changed into alanine and were shown in light color. Mutations for the S/G2 stable version were shown below. (B) Schematic illustration of baits and experimental setup. (C) Amino acid sequence of DCAF11 with the peptides recovered in LC-MS/MS.
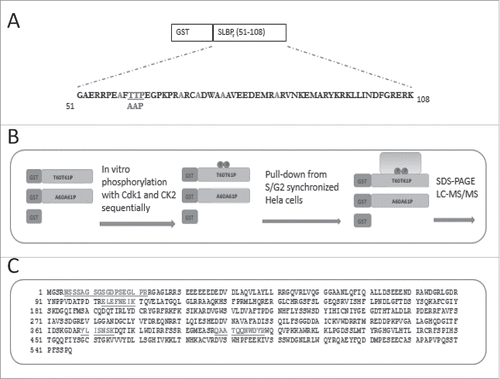
Figure 1. Experimental setup for pull-downs. (A) Amino acid sequence of SLBP fragment, sufficient to mediate S/G2 degration of SLBP. All the possible phosphoacceptor sites other than Thr 60 and Thr 61 were changed into alanine and were shown in light color. Mutations for the S/G2 stable version were shown below. (B) Schematic illustration of baits and experimental setup. (C) Amino acid sequence of DCAF11 with the peptides recovered in LC-MS/MS.

Figure 2. DCAF11 and Cul4A were pulled down by GST-SLBP fragment depending on phosphorylations on Thr 60 and Thr 61. HeLa cells were transfected with HA-DCAF11 (A) or Myc-Cul4A (B) and collected 48 hrs after transfection. Cells were lysed and pull-downs were performed with the indicated baits as explained in the materials and methods. GST-SLBPF (pTpTP) indicates phosphorylations on Thr 60 and Thr 61. Pull-downs were run on SDS-PAGE and immunoblotted for HA-DCAF11 or Myc-Cul4A. The amounts of baits were assessed by Comassie Briliant Blue (CBB) staining.
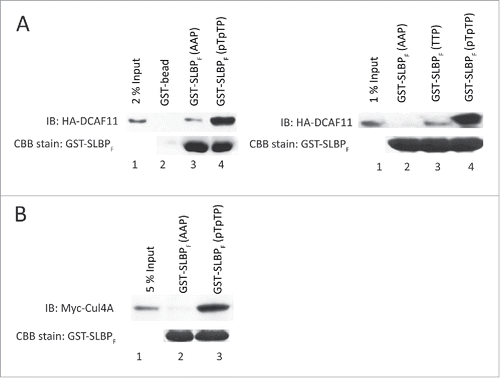
Figure 2. DCAF11 and Cul4A were pulled down by GST-SLBP fragment depending on phosphorylations on Thr 60 and Thr 61. HeLa cells were transfected with HA-DCAF11 (A) or Myc-Cul4A (B) and collected 48 hrs after transfection. Cells were lysed and pull-downs were performed with the indicated baits as explained in the materials and methods. GST-SLBPF (pTpTP) indicates phosphorylations on Thr 60 and Thr 61. Pull-downs were run on SDS-PAGE and immunoblotted for HA-DCAF11 or Myc-Cul4A. The amounts of baits were assessed by Comassie Briliant Blue (CBB) staining.

Figure 3. Ectopic expression of DCAF11 induces proteasome mediated degradation of SLBP. (A) HeLa cells were transfected with the empty vector (EV) or HA-DCAF11 construct and collected 48 hrs after transfection. Cells were lysed and whole cell extracts were immunblotted for HA-DCAF11, SLBP and Skp1 (as a loading control). SLBP levels were quantified and the level in the EV cells was set to 1. In the right panel, results from 3 independent experiments were graphed as Mean ± SD. (B) HeLa cells were transfected with EV or HA-DCAF11 construct. 48 hours after transfection, BrdU was introduced into the cultures for 2 hours and BrdU incorporation levels were quantified using colorimetric detection kit as explained in materials and methods. Mean BrdU incorporation values (n = 3) ± SD were graphed as a percentage of the levels detected in the EV transfected cells. (C) Cell cycle profiles of the cells were determined by PI (Propidium Iodide) staining followed by Flow Cytometry analysis. Right pannel shows the mean ± SD of 3 independent experiments. (D) Cells were transfected with EV or HA-DCAF11 and collected 48 after the transfection. In the lane 3, protesome inhibitor (MG132) was added for the last 2 hrs before collection. Cells were lysed and immunblotted for HA-DCAF11, SLBP and Skp1.
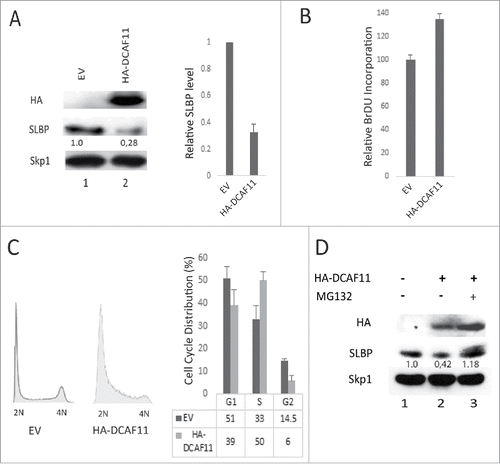
Figure 3. Ectopic expression of DCAF11 induces proteasome mediated degradation of SLBP. (A) HeLa cells were transfected with the empty vector (EV) or HA-DCAF11 construct and collected 48 hrs after transfection. Cells were lysed and whole cell extracts were immunblotted for HA-DCAF11, SLBP and Skp1 (as a loading control). SLBP levels were quantified and the level in the EV cells was set to 1. In the right panel, results from 3 independent experiments were graphed as Mean ± SD. (B) HeLa cells were transfected with EV or HA-DCAF11 construct. 48 hours after transfection, BrdU was introduced into the cultures for 2 hours and BrdU incorporation levels were quantified using colorimetric detection kit as explained in materials and methods. Mean BrdU incorporation values (n = 3) ± SD were graphed as a percentage of the levels detected in the EV transfected cells. (C) Cell cycle profiles of the cells were determined by PI (Propidium Iodide) staining followed by Flow Cytometry analysis. Right pannel shows the mean ± SD of 3 independent experiments. (D) Cells were transfected with EV or HA-DCAF11 and collected 48 after the transfection. In the lane 3, protesome inhibitor (MG132) was added for the last 2 hrs before collection. Cells were lysed and immunblotted for HA-DCAF11, SLBP and Skp1.

Figure 4. DCAF11 interacts with wild type, but not Thr 61/Ala mutant SLBP. (A) HeLa cells were transfected with HA-DCAF11 along with hisSLBP. Cells were treated with MG132 for the last 4 hrs before collection. Cells were lysed and immunoprecipitations with nonspecific IgG or anti-SLBP were performed. Whole cell extract (input) and immunoprecipitates were analyzed by western blot for indicated proteins. (B) HeLa cells were transfected with HA-DCAF11 along with wild type hisSLBP (TTP) or Thr61/Ala mutant hisSLBP (TAP). Whole cell extracts (input) were subjected to immunoprecipitation (IP) with either nonspesific IgG or anti-HA and immunoprecipitates were immunoblotted for indicated proteins.
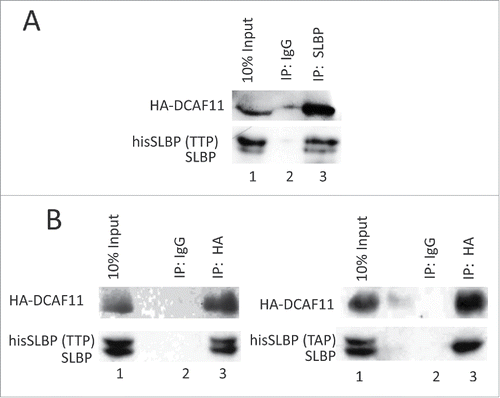
Figure 4. DCAF11 interacts with wild type, but not Thr 61/Ala mutant SLBP. (A) HeLa cells were transfected with HA-DCAF11 along with hisSLBP. Cells were treated with MG132 for the last 4 hrs before collection. Cells were lysed and immunoprecipitations with nonspecific IgG or anti-SLBP were performed. Whole cell extract (input) and immunoprecipitates were analyzed by western blot for indicated proteins. (B) HeLa cells were transfected with HA-DCAF11 along with wild type hisSLBP (TTP) or Thr61/Ala mutant hisSLBP (TAP). Whole cell extracts (input) were subjected to immunoprecipitation (IP) with either nonspesific IgG or anti-HA and immunoprecipitates were immunoblotted for indicated proteins.

Figure 5. SLBP interacts with Cul4A. HeLa cells were transfected with Myc-Cul4A, HA-DCAF11 and hisSLBP. Cells were treated with MG132 for the last 4 hours before collection. Cells were lysed and immunoprecipitations with either nonspecific IgG, anti-SLBP (A) or anti-Myc (B) were performed. Whole cell extracts (input) and immunoprecipitates were analyzed with western blot for indicated proteins.
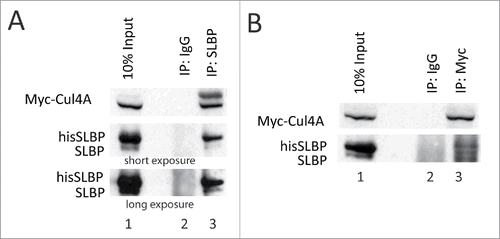
Figure 5. SLBP interacts with Cul4A. HeLa cells were transfected with Myc-Cul4A, HA-DCAF11 and hisSLBP. Cells were treated with MG132 for the last 4 hours before collection. Cells were lysed and immunoprecipitations with either nonspecific IgG, anti-SLBP (A) or anti-Myc (B) were performed. Whole cell extracts (input) and immunoprecipitates were analyzed with western blot for indicated proteins.

Figure 6. Knockdown of DCAF11 induces SLBP expression. (A) HeLa cells were transfected with control (non-targeting) or DCAF11 specific siRNA, and collected 48 hrs after transfection. Cells were lysed and whole cell extracts were immunoblotted for DCAF11, SLBP, Cyclin A and Skp1. SLBP levels were quantified and the level in the control cells was set to 1. Results from 3 independent experiments were graphed as mean ± SD in the panel on the right. (B) BrdU incorporation levels were quantified as explained in the materials and methods using colorimetric detection kit. Mean values (n = 3) ± SD were graphed as a percentage of the control siRNA transfected cells (C) Cell cycle profiles of the cells were determined by PI staining followed by Flow Cytometry analysis. In the right panel, results from 3 independent experiments were graphed as mean ± SD.
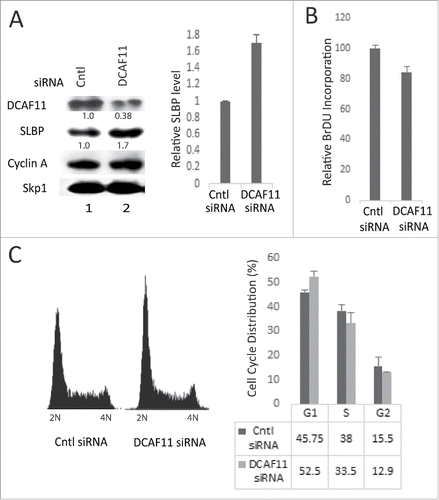
Figure 6. Knockdown of DCAF11 induces SLBP expression. (A) HeLa cells were transfected with control (non-targeting) or DCAF11 specific siRNA, and collected 48 hrs after transfection. Cells were lysed and whole cell extracts were immunoblotted for DCAF11, SLBP, Cyclin A and Skp1. SLBP levels were quantified and the level in the control cells was set to 1. Results from 3 independent experiments were graphed as mean ± SD in the panel on the right. (B) BrdU incorporation levels were quantified as explained in the materials and methods using colorimetric detection kit. Mean values (n = 3) ± SD were graphed as a percentage of the control siRNA transfected cells (C) Cell cycle profiles of the cells were determined by PI staining followed by Flow Cytometry analysis. In the right panel, results from 3 independent experiments were graphed as mean ± SD.

Figure 7. Cul4A and SLBP interaction is impaired by DCAF11 RNAi. HeLa cells were transfected with Myc-Cul4A along with control (non-targeting) or DCAF11 spesific siRNAs. Cells were lysed and immunoprecipitations with non-spesific IgG or anti-Myc were performed. Whole cell extracts (input) and immunoprecipitates were analyzed by western blot for indicated proteins.
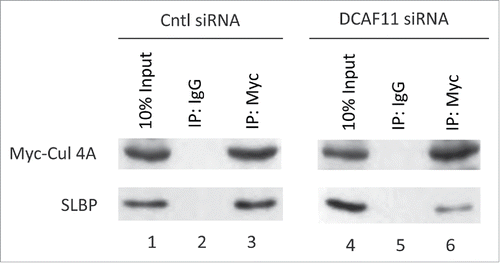
Figure 7. Cul4A and SLBP interaction is impaired by DCAF11 RNAi. HeLa cells were transfected with Myc-Cul4A along with control (non-targeting) or DCAF11 spesific siRNAs. Cells were lysed and immunoprecipitations with non-spesific IgG or anti-Myc were performed. Whole cell extracts (input) and immunoprecipitates were analyzed by western blot for indicated proteins.

Figure 8. S/G2 stable mutant SLBP induces cell death in HeLa cells. HeLa cells were transfected with EV, wild type hisSLBP (TTP) or S/G2 stable mutant (Thr 61/Ala) hisSLBP (TAP). (A) 48 hrs after the transfection, cell death levels were assessed by LDH release assay, (B) cell viability was quantified using Wst-1 viability assay, and (C) BrdU incorporation levels were quantified as explained in the materials and methods using colorimetric detection kit. Mean (n = 3) ± SD were graphed as a percentage of the values detected in the EV transfected cells. (D) Cell cycle profiles of the cells were determined by PI staining, followed by Flow Cytometry analysis. (E) Cells were lysed and whole cell extracts were immunoblotted for SLBP and Skp1.
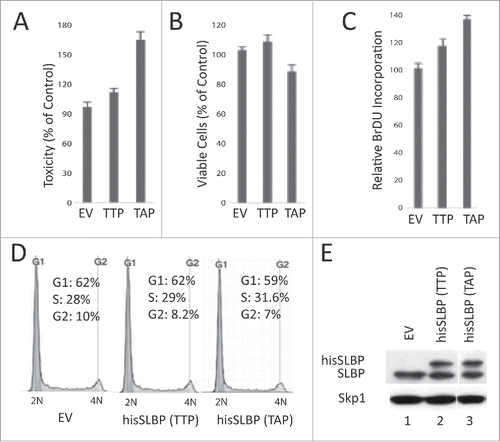
Figure 8. S/G2 stable mutant SLBP induces cell death in HeLa cells. HeLa cells were transfected with EV, wild type hisSLBP (TTP) or S/G2 stable mutant (Thr 61/Ala) hisSLBP (TAP). (A) 48 hrs after the transfection, cell death levels were assessed by LDH release assay, (B) cell viability was quantified using Wst-1 viability assay, and (C) BrdU incorporation levels were quantified as explained in the materials and methods using colorimetric detection kit. Mean (n = 3) ± SD were graphed as a percentage of the values detected in the EV transfected cells. (D) Cell cycle profiles of the cells were determined by PI staining, followed by Flow Cytometry analysis. (E) Cells were lysed and whole cell extracts were immunoblotted for SLBP and Skp1.
Supplemental material

Supplemental_Material.zip

Download Zip (1.2 MB)

Reprints and Corporate Permissions

Please note: Selecting permissions does not provide access to the full text of the article, please see our help page How do I view content?

To request a reprint or corporate permissions for this article, please click on the relevant link below:

Academic Permissions

Please note: Selecting permissions does not provide access to the full text of the article, please see our help page How do I view content?

Obtain permissions instantly via Rightslink by clicking on the button below:

If you are unable to obtain permissions via Rightslink, please complete and submit this Permissions form. For more information, please visit our Permissions help page.