1,044
Views
15
CrossRef citations to date
0
Altmetric
Reports

Impaired cell proliferation in regenerating liver of 3 β-hydroxysterol Δ14-reductase (TM7SF2) knock-out mice

, , , , , & show all
Pages 2164-2173 | Received 15 Apr 2016, Accepted 22 May 2016, Published online: 14 Jul 2016

Figures & data

Figure 1. Expression of C14-SR and LBR during liver regeneration (A) Time course of Tm7sf2 mRNA expression in WT regenerating liver. The expression was normalized to mouse Gapdh. The amount of mRNA is expressed in relative fold of expression. Bars represent means ± SD (n = 3). (B) Lbr mRNA expression in regenerating liver in WT and Tm7sf2 KO mice. The expression was normalized to mouse Gapdh levels at each time point. The amount of mRNA is expressed in relative fold of expression. Bars represent means ± SD (n = 3). (C) Protein expression levels of C14-SR and LBR in regenerating livers from WT and Tm7sf2 KO mice, determined by Western Blotting (WB). Coomassie blue staining was used as loading control. Representative images are shown. Graphs represent the densitometric quantification of immunoblotting signal. Values are normalized to the level of histones staining with Coomassie Blue.
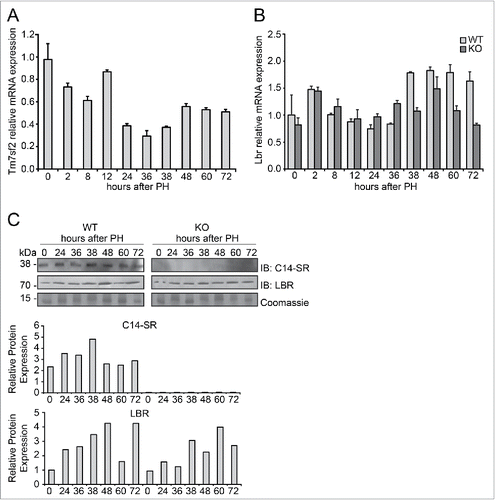
Figure 1. Expression of C14-SR and LBR during liver regeneration (A) Time course of Tm7sf2 mRNA expression in WT regenerating liver. The expression was normalized to mouse Gapdh. The amount of mRNA is expressed in relative fold of expression. Bars represent means ± SD (n = 3). (B) Lbr mRNA expression in regenerating liver in WT and Tm7sf2 KO mice. The expression was normalized to mouse Gapdh levels at each time point. The amount of mRNA is expressed in relative fold of expression. Bars represent means ± SD (n = 3). (C) Protein expression levels of C14-SR and LBR in regenerating livers from WT and Tm7sf2 KO mice, determined by Western Blotting (WB). Coomassie blue staining was used as loading control. Representative images are shown. Graphs represent the densitometric quantification of immunoblotting signal. Values are normalized to the level of histones staining with Coomassie Blue.

Figure 2. Analysis of lipid content during liver regeneration in Tm7sf2 KO mice. (A) Cholesterol levels in liver and plasma during liver regeneration in WT and Tm7sf2 KO mice. Bars represent means ± SEM (n = 3–6). (B) Triglycerides levels in liver and plasma during liver regeneration in WT and Tm7sf2 KO mice. Bars represent means ± SEM (n = 3-6). Significant changes are shown. * P < 0.05, ** P < 0.01. (C) Lipid droplets formation in hepatocytes in WT and Tm7sf2 KO mice during liver regeneration, evaluated in paraffin-embedded liver sections harvested and stained with HE. Representative images are shown (magnification, 1000X). Bars indicate 10 µm.
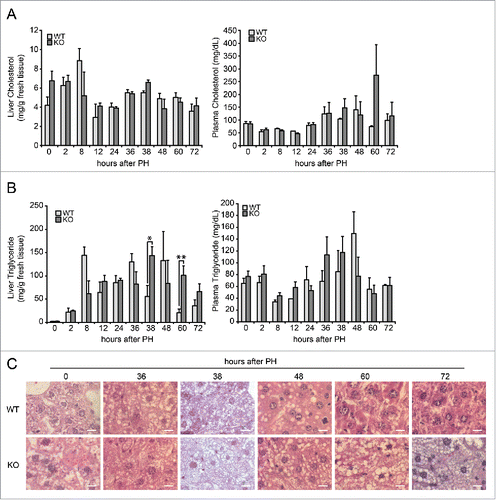
Figure 2. Analysis of lipid content during liver regeneration in Tm7sf2 KO mice. (A) Cholesterol levels in liver and plasma during liver regeneration in WT and Tm7sf2 KO mice. Bars represent means ± SEM (n = 3–6). (B) Triglycerides levels in liver and plasma during liver regeneration in WT and Tm7sf2 KO mice. Bars represent means ± SEM (n = 3-6). Significant changes are shown. * P < 0.05, ** P < 0.01. (C) Lipid droplets formation in hepatocytes in WT and Tm7sf2 KO mice during liver regeneration, evaluated in paraffin-embedded liver sections harvested and stained with HE. Representative images are shown (magnification, 1000X). Bars indicate 10 µm.

Figure 3. Defective proliferation in Tm7sf2 KO regenerating livers (A) Representative micrographs of liver sections collected from WT and Tm7sf2 KO mice after PH, immunostained with anti-BrdU antibody (green). Cryosections were additionally stained with DAPI (blue). Representative merge images are shown. Bars indicate 10 µm. Magnification, 200X. (B) Quantitative analysis of BrdU labeling index (% of BrdU-positive hepatocytes) at each time of liver regeneration of WT and Tm7sf2 KO mice. Results represent means ± SD (n = 3). Significant changes are shown. *** P < 0.001 (C) Quantitative analysis of total BrdU labeled nuclei in the regenerating liver of WT and Tm7sf2 KO mice, obtained by summing the % of BrdU-positive cells at all experimental time points. Results represent means ± SD (n = 3). Significant changes are shown. ** P < 0.01. (D) Micrographs of liver sections, collected from WT and Tm7sf2 KO mice after PH, immunostained with monoclonal pH3 antibody (green) and DAPI (blue). Representative merge images are shown. Bars indicate 10 µm. Magnification, 400X. (E) Percentage of pH3-positive cells during liver regeneration in WT and Tm7sf2 KO mice. Results are means ± SD (n = 3). Significant changes are shown. ** P < 0.01. (F) Representative image of hepatocytes in G2 and M phase of the cell cycle in regenerating liver of WT and Tm7sf2 KO mice. Histological slides were immunostained with anti-pH3 antibody (red) and DAPI (blue). Merge images are shown. Bars indicate 10 µm. (G) Percentage of pH3-positive cells distinct from G2 and M phase at 48 hours PH in Tm7sf2 WT and Tm7sf2 KO mice. Results are means ± SD (n = 3). (H) Mitotic index determined by counting the percentage of mitotic figures on liver regenerating sections stained by H-E. Results are means ± SEM (n = 3-6). Significant changes are shown. ** P < 0.01, *** P < 0.001.
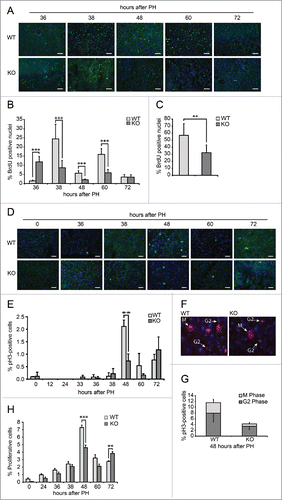
Figure 3. Defective proliferation in Tm7sf2 KO regenerating livers (A) Representative micrographs of liver sections collected from WT and Tm7sf2 KO mice after PH, immunostained with anti-BrdU antibody (green). Cryosections were additionally stained with DAPI (blue). Representative merge images are shown. Bars indicate 10 µm. Magnification, 200X. (B) Quantitative analysis of BrdU labeling index (% of BrdU-positive hepatocytes) at each time of liver regeneration of WT and Tm7sf2 KO mice. Results represent means ± SD (n = 3). Significant changes are shown. *** P < 0.001 (C) Quantitative analysis of total BrdU labeled nuclei in the regenerating liver of WT and Tm7sf2 KO mice, obtained by summing the % of BrdU-positive cells at all experimental time points. Results represent means ± SD (n = 3). Significant changes are shown. ** P < 0.01. (D) Micrographs of liver sections, collected from WT and Tm7sf2 KO mice after PH, immunostained with monoclonal pH3 antibody (green) and DAPI (blue). Representative merge images are shown. Bars indicate 10 µm. Magnification, 400X. (E) Percentage of pH3-positive cells during liver regeneration in WT and Tm7sf2 KO mice. Results are means ± SD (n = 3). Significant changes are shown. ** P < 0.01. (F) Representative image of hepatocytes in G2 and M phase of the cell cycle in regenerating liver of WT and Tm7sf2 KO mice. Histological slides were immunostained with anti-pH3 antibody (red) and DAPI (blue). Merge images are shown. Bars indicate 10 µm. (G) Percentage of pH3-positive cells distinct from G2 and M phase at 48 hours PH in Tm7sf2 WT and Tm7sf2 KO mice. Results are means ± SD (n = 3). (H) Mitotic index determined by counting the percentage of mitotic figures on liver regenerating sections stained by H-E. Results are means ± SEM (n = 3-6). Significant changes are shown. ** P < 0.01, *** P < 0.001.

Figure 4. Expression of markers of G1/S phase during liver regeneration in Tm7sf2 KO mice (A) mRNA levels of expression of cyclin D1, Cdk4, cyclin A and cyclin E1, detected by qPCR in WT and Tm7sf2 KO mice during liver regeneration at different times following PH. The expression of each gene was normalized to mouse Gapdh levels. The amount of mRNA is expressed in relative fold of expression. Bars represent means ± SD (n = 3). (B, C) Protein expression levels of cyclin D1, cyclin E (B), cyclin A and cdk4 (C) in regenerating livers from WT and Tm7sf2 KO mice, evaluated by WB. Coomassie Blue staining was used as loading control. Representative images are shown. Graphs represent the densitometric quantification of immunoblotting signal.
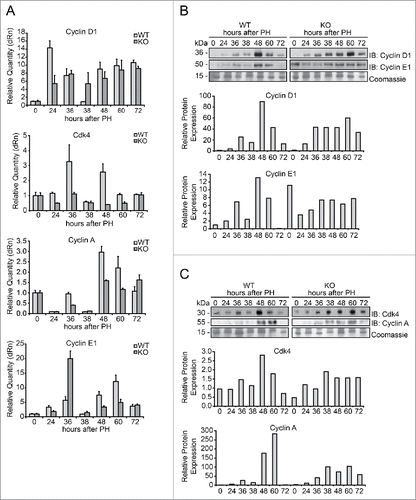
Figure 4. Expression of markers of G1/S phase during liver regeneration in Tm7sf2 KO mice (A) mRNA levels of expression of cyclin D1, Cdk4, cyclin A and cyclin E1, detected by qPCR in WT and Tm7sf2 KO mice during liver regeneration at different times following PH. The expression of each gene was normalized to mouse Gapdh levels. The amount of mRNA is expressed in relative fold of expression. Bars represent means ± SD (n = 3). (B, C) Protein expression levels of cyclin D1, cyclin E (B), cyclin A and cdk4 (C) in regenerating livers from WT and Tm7sf2 KO mice, evaluated by WB. Coomassie Blue staining was used as loading control. Representative images are shown. Graphs represent the densitometric quantification of immunoblotting signal.
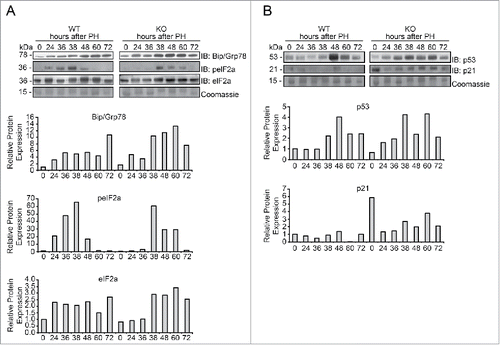
Figure 5. Evaluation of the ER stress response in Tm7sf2 KO mice during liver regeneration (A) WB analysis of Bip/Grp78, eIF2a and p-eIF2a protein expression during liver regeneration in WT and Tm7sf2 KO mice. The control of the proteins amount is represented by Coomassie Blue staining. Representative images are shown. Graphs represent the densitometric quantification of immunoblotting signal. (B) Levels of expression of the proteins p53 and p21, evaluated by WB. Coomassie Blue staining was used as loading control. Representative images are shown. Graphs represent the densitometric quantification of immunoblotting signal.

Figure 5. Evaluation of the ER stress response in Tm7sf2 KO mice during liver regeneration (A) WB analysis of Bip/Grp78, eIF2a and p-eIF2a protein expression during liver regeneration in WT and Tm7sf2 KO mice. The control of the proteins amount is represented by Coomassie Blue staining. Representative images are shown. Graphs represent the densitometric quantification of immunoblotting signal. (B) Levels of expression of the proteins p53 and p21, evaluated by WB. Coomassie Blue staining was used as loading control. Representative images are shown. Graphs represent the densitometric quantification of immunoblotting signal.
Supplemental material

1195939_Supplemental_Material.docx

Download MS Word (220 KB)

Reprints and Corporate Permissions

Please note: Selecting permissions does not provide access to the full text of the article, please see our help page How do I view content?

To request a reprint or corporate permissions for this article, please click on the relevant link below:

Academic Permissions

Please note: Selecting permissions does not provide access to the full text of the article, please see our help page How do I view content?

Obtain permissions instantly via Rightslink by clicking on the button below:

If you are unable to obtain permissions via Rightslink, please complete and submit this Permissions form. For more information, please visit our Permissions help page.