1,429
Views
4
CrossRef citations to date
0
Altmetric
Reports

Dynamic regulation of histone H3K9 is linked to the switch between replication and transcription at the Dbf4 origin-promoter locus

, , , &
Pages 2321-2335 | Received 25 Mar 2016, Accepted 08 Jun 2016, Published online: 15 Jul 2016

Figures & data

Figure 1. The levels of transcription and DNA replication activities at the Dbf4 locus showed an inverse relation. (A). A representative cell cycle profile of HeLa S3 cells synchronized using a double thymidine (DT) arrest-and-release method. “AS” denotes asynchronous cells. (B) The levels of transcription and DNA replication activities at the human Dbf4 locus showed an inverse relation. Nascent strand abundance assays were performed using short, single-stranded (1–2 kb) DNA isolated at the indicated time points post-G1/S, and drawn in a schematic from (for detail, see in the cited reference). Citation39,40 Quantification data for mRNA abundance for 2 independent experiments were plotted against Dbf4 origin activity to show relative abundance of transcript versus replication activity. (C) Northern blotting of Dbf4 mRNA isolated from HeLa S3 cells synchronized at G1/S-and-released is shown. Total 18S rRNA was used as a loading control. (D) The level of Dbf4 pre-mRNA and Dbf4 origin activity are regulated in a cell-cycle dependent manner. HeLa S3 cells were synchronized at the G1/S border by DT treatment (0 h), followed by release into cell cycle for the indicated duration (0.5 h to 6 h). Total RNA was extracted from each sample and reverse transcription was performed using a primer specific for the first intron of the Dbf4 pre-mRNA. PCR reactions were carried out using a primer pair mapped within the first exon of the Dbf4 mRNA. NTC, no template control; -RT, control reactions in the absence of reverse transcriptase. To confirm that the amplification was within a semi-quantifiable range, PCR reactions were performed using serial dilutions of cDNA prepared from asynchronous HeLa S3 cells. The mid-point of this dilution range (0.1) was used for amplification of the subsequent reactions. (E) The level of Dbf4 pre-mRNA was dramatically decreased as the origin activity increased. Quantification data for pre-mRNA abundance was plotted against Dbf4 origin activity to show relative abundance of transcript vs. replication activity.
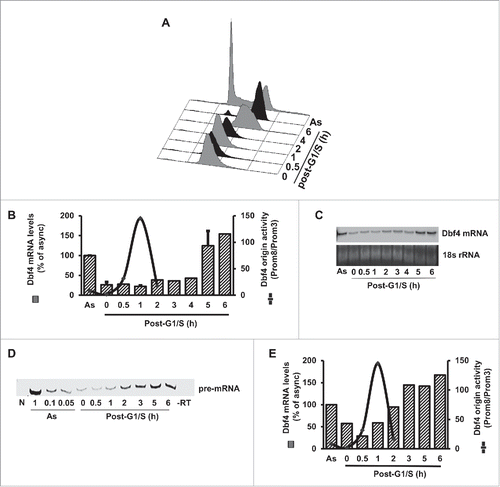
Figure 1. The levels of transcription and DNA replication activities at the Dbf4 locus showed an inverse relation. (A). A representative cell cycle profile of HeLa S3 cells synchronized using a double thymidine (DT) arrest-and-release method. “AS” denotes asynchronous cells. (B) The levels of transcription and DNA replication activities at the human Dbf4 locus showed an inverse relation. Nascent strand abundance assays were performed using short, single-stranded (1–2 kb) DNA isolated at the indicated time points post-G1/S, and drawn in a schematic from (for detail, see Fig. 2 in the cited reference). Citation39,40 Quantification data for mRNA abundance for 2 independent experiments were plotted against Dbf4 origin activity to show relative abundance of transcript versus replication activity. (C) Northern blotting of Dbf4 mRNA isolated from HeLa S3 cells synchronized at G1/S-and-released is shown. Total 18S rRNA was used as a loading control. (D) The level of Dbf4 pre-mRNA and Dbf4 origin activity are regulated in a cell-cycle dependent manner. HeLa S3 cells were synchronized at the G1/S border by DT treatment (0 h), followed by release into cell cycle for the indicated duration (0.5 h to 6 h). Total RNA was extracted from each sample and reverse transcription was performed using a primer specific for the first intron of the Dbf4 pre-mRNA. PCR reactions were carried out using a primer pair mapped within the first exon of the Dbf4 mRNA. NTC, no template control; -RT, control reactions in the absence of reverse transcriptase. To confirm that the amplification was within a semi-quantifiable range, PCR reactions were performed using serial dilutions of cDNA prepared from asynchronous HeLa S3 cells. The mid-point of this dilution range (0.1) was used for amplification of the subsequent reactions. (E) The level of Dbf4 pre-mRNA was dramatically decreased as the origin activity increased. Quantification data for pre-mRNA abundance was plotted against Dbf4 origin activity to show relative abundance of transcript vs. replication activity.

Figure 2. Transcription and DNA replication proteins localize to the Dbf4 locus in a cell cycle-dependent manner. (A) The physical map of the Dbf4 locus and primer locations within the region are shown. Numbers in parenthesis correspond to relative positions with respect to the “A” of the Dbf4 translation start codon, which is taken as +1. Replication initiation zones I and II are represented by black boxes, and directions of replication initiations are indicated by large black arrows. Primer sequences are shown in Table S1. (B, C) Transcription factors Sp1 and TFIIB are absent from the Dbf4 locus during DNA replication. ChIP analysis was performed using an antibody specific for Sp1 or TFIIB on extracts isolated from asynchronous HeLa S3 cells and cells synchronized at the G1/S border (0 h)-and-released for the indicated duration (1 h and 6 h). Resultant chromatin pull-down by anti-Sp1 or anti-TFIIB antibody was assayed by qPCR using indicated primer sets. Values represent mean ± SD, n>2. (D) Orc4 enrichment is diminished during S phase at the Dbf4 locus. ChIP was performed with an antibody specific for Orc4 as described above. Values represent mean ± SD, n > 2. (E) MCM is absent from the Dbf4 locus during G1-S phase. Lysates collected as above were analyzed using ChIP with antibodies mix of MCM proteins (Mcm 2/3/6/7). Values represent mean ± SD, n > 2.
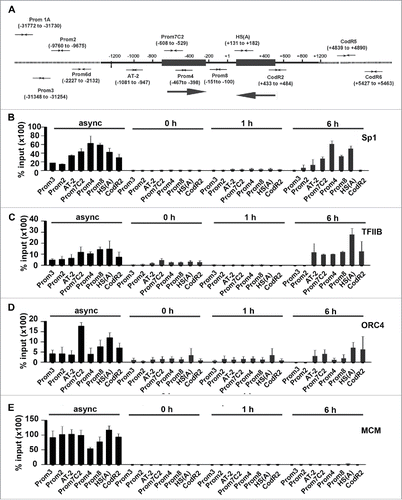
Figure 2. Transcription and DNA replication proteins localize to the Dbf4 locus in a cell cycle-dependent manner. (A) The physical map of the Dbf4 locus and primer locations within the region are shown. Numbers in parenthesis correspond to relative positions with respect to the “A” of the Dbf4 translation start codon, which is taken as +1. Replication initiation zones I and II are represented by black boxes, and directions of replication initiations are indicated by large black arrows. Primer sequences are shown in Table S1. (B, C) Transcription factors Sp1 and TFIIB are absent from the Dbf4 locus during DNA replication. ChIP analysis was performed using an antibody specific for Sp1 or TFIIB on extracts isolated from asynchronous HeLa S3 cells and cells synchronized at the G1/S border (0 h)-and-released for the indicated duration (1 h and 6 h). Resultant chromatin pull-down by anti-Sp1 or anti-TFIIB antibody was assayed by qPCR using indicated primer sets. Values represent mean ± SD, n>2. (D) Orc4 enrichment is diminished during S phase at the Dbf4 locus. ChIP was performed with an antibody specific for Orc4 as described above. Values represent mean ± SD, n > 2. (E) MCM is absent from the Dbf4 locus during G1-S phase. Lysates collected as above were analyzed using ChIP with antibodies mix of MCM proteins (Mcm 2/3/6/7). Values represent mean ± SD, n > 2.

Figure 3. Chromatin modifying proteins flank Dbf4 origin in a cell cycle-dependent manner. (A, B) Cohesin subunits, Smc1 and Smc3, are present at the Dbf4 locus in a cell cycle-dependent manner. ChIP assays were carried out with antibodies specific for Smc1 and Smc3 from cell extracts prepared from asynchronous HeLa S3 cells or those sampled at indicated time points post-G1/S. Chromatin was analyzed using qPCR with primer sets indicated. (C, D) The association of the Med1 and Med12 with the Dbf4 origin is cell cycle-dependent. ChIP assays were carried out with antibodies specific for Med1 or Med12 from extracts isolated from asynchronous HeLa S3 cells or those sampled at indicated time points post-G1/S. DNA bound by the protein was analyzed using qPCR with indicated primer sets. In all cases, percent input was determined by the amount of DNA enriched, less background, recovered by rabbit IgG (normal rabbit IgG), and then expressed the result relative to 6 ng input DNA sample. Values represent mean ± SD, n = 6. The entire data set is summarized in Figure S3.
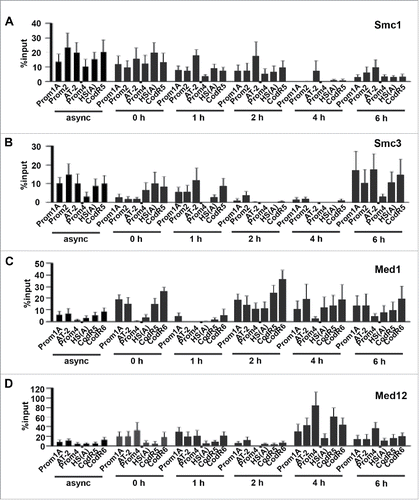
Figure 3. Chromatin modifying proteins flank Dbf4 origin in a cell cycle-dependent manner. (A, B) Cohesin subunits, Smc1 and Smc3, are present at the Dbf4 locus in a cell cycle-dependent manner. ChIP assays were carried out with antibodies specific for Smc1 and Smc3 from cell extracts prepared from asynchronous HeLa S3 cells or those sampled at indicated time points post-G1/S. Chromatin was analyzed using qPCR with primer sets indicated. (C, D) The association of the Med1 and Med12 with the Dbf4 origin is cell cycle-dependent. ChIP assays were carried out with antibodies specific for Med1 or Med12 from extracts isolated from asynchronous HeLa S3 cells or those sampled at indicated time points post-G1/S. DNA bound by the protein was analyzed using qPCR with indicated primer sets. In all cases, percent input was determined by the amount of DNA enriched, less background, recovered by rabbit IgG (normal rabbit IgG), and then expressed the result relative to 6 ng input DNA sample. Values represent mean ± SD, n = 6. The entire data set is summarized in Figure S3.

Figure 4. The human Dbf4 origin-promoter locus contains a nucleosome-depleted region. (A) The region represented by prom4 is the most hypersensitive to DNase I digestion within the Dbf4 gene locus. HeLa S3 cells were treated with different concentrations of DNase I. An aliquot of 8 ng of chromatin isolates was quantitated by qPCR with various primer pairs indicated (all sequences were derived from chromosome 7). The non-origin sequence amplified by the Prom3 primer set represents a negative control.Citation39,40 Values represent mean ± standard error of the mean (SEM), n = 2–5. Values are presented on a logarithmic scale. (B) Histone H3 binding locations at the human Dbf4 locus. A ChIP assay with sonicated chromatin was carried out with asynchronous HeLa S3 cells using an antibody specific for histone H3. The resultant randomly fragmented DNA was subjected to quantification by qPCR. Percent input values was determined by subtracting output value recovered by normal (pre-immune) rabbit immunoglobulin G from H3 output value, then expressed the result relative to 6 ng input DNA sample. Values represent mean ± SD, n = 2. *P < 0.05; **P < 0.01 relative to Prom4 percent input. (C) Histone H3 binds to the non-origin control region. ChIP was performed as above for regions represented by Prom3, Prom4 and HS(A) primer sets. Values represent mean ± SD, n = 2. **P < 0.01. (D) Summary of results shown in . Putative nucleosome locations identified are indicated by gray hexagons.
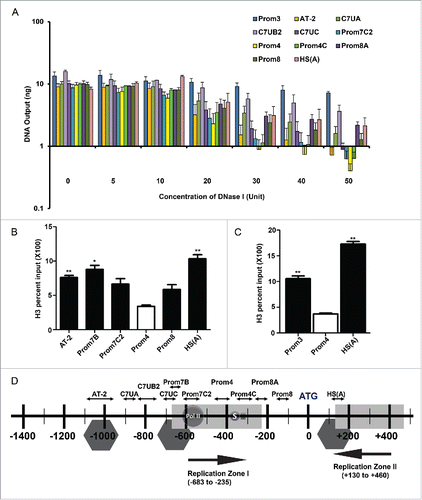
Figure 4. The human Dbf4 origin-promoter locus contains a nucleosome-depleted region. (A) The region represented by prom4 is the most hypersensitive to DNase I digestion within the Dbf4 gene locus. HeLa S3 cells were treated with different concentrations of DNase I. An aliquot of 8 ng of chromatin isolates was quantitated by qPCR with various primer pairs indicated (all sequences were derived from chromosome 7). The non-origin sequence amplified by the Prom3 primer set represents a negative control.Citation39,40 Values represent mean ± standard error of the mean (SEM), n = 2–5. Values are presented on a logarithmic scale. (B) Histone H3 binding locations at the human Dbf4 locus. A ChIP assay with sonicated chromatin was carried out with asynchronous HeLa S3 cells using an antibody specific for histone H3. The resultant randomly fragmented DNA was subjected to quantification by qPCR. Percent input values was determined by subtracting output value recovered by normal (pre-immune) rabbit immunoglobulin G from H3 output value, then expressed the result relative to 6 ng input DNA sample. Values represent mean ± SD, n = 2. *P < 0.05; **P < 0.01 relative to Prom4 percent input. (C) Histone H3 binds to the non-origin control region. ChIP was performed as above for regions represented by Prom3, Prom4 and HS(A) primer sets. Values represent mean ± SD, n = 2. **P < 0.01. (D) Summary of results shown in Figure 4A–D. Putative nucleosome locations identified are indicated by gray hexagons.

Figure 5. ψDbf410 does not contain an origin of DNA replication. (A) Shown are physical maps of the human Dbf4 gene on chromosome 7 and a Dbf4 pseudogene on the chromosome 10 (ψDbf410). Filled or hatched boxes (E1 to E12) denote exons as determined from the nucleotide sequences reported previously (Accession #AF160249). The empty square box denotes the basal Dbf4 promoter.Citation41 Primer sets used for qPCR are shown as pairs of converging arrows. Numbers in brackets denote the positions of 5′ ends of primers relative to the Dbf4 translational start-codon (“A” of ATG is taken as +1). Single arrows at the left-top of the figure (labeled I, II and III) are primers used for standard PCR. Primer sequences are shown in Table S1. (B) The presence of ψDbf410 in the HeLa S3, HEK293 and 293T cell lines was confirmed by PCR-based mapping. Reactions were carried out using genomic DNA isolated from each cell line and the primers indicated (I to III). PCR products were separated by 1% agarose-gel electrophoresis. “L” and “NTC” denote DNA size ladder and no-template-control, respectively. PCR templates were isolated from cell lines indicated. HL denotes HeLa S3 cells. (C) Analysis of replication initiation at the ψDbf410. Nascent strand abundance assays were carried out with 1 SYMBOL 0150 /* MERGEFORMAT 2 kb newly synthesized single-stranded DNA templates isolated from asynchronous HeLa S3 cells and qPCR primer pairs shown (primer positions are shown in ). Relative sequence abundance was calculated using Prom3 sequence on chromosome 7 as reference.Citation39 The DNA segments amplified by Prom7B and HS(A) primer sets represent, respectively, replication initiation zones I and II at the Dbf4 origin locus (which is missing in ψDbf410),Citation39 and the region amplified by the primer sets Chr10 UPS is unique to ψDbf410. * denotes that enrichment of nascent strands at both Prom7B and HS(A) are significantly higher than the Chr10UPS, p < 0.05 for both (*** p < 0.001 for Prom7B) according to Dunnett's test with Chr10 UPS as control. (1-way ANOVA, p = 0.0003, F = 6.521, df = 26).
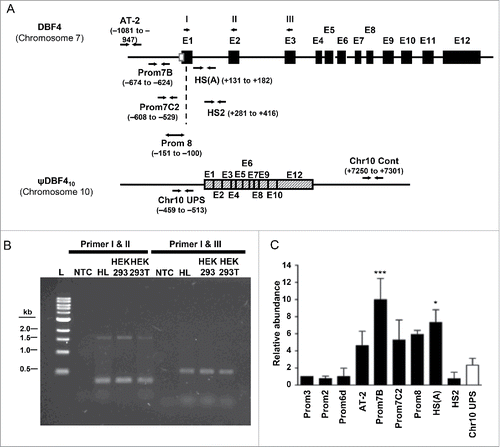
Figure 5. ψDbf410 does not contain an origin of DNA replication. (A) Shown are physical maps of the human Dbf4 gene on chromosome 7 and a Dbf4 pseudogene on the chromosome 10 (ψDbf410). Filled or hatched boxes (E1 to E12) denote exons as determined from the nucleotide sequences reported previously (Accession #AF160249). The empty square box denotes the basal Dbf4 promoter.Citation41 Primer sets used for qPCR are shown as pairs of converging arrows. Numbers in brackets denote the positions of 5′ ends of primers relative to the Dbf4 translational start-codon (“A” of ATG is taken as +1). Single arrows at the left-top of the figure (labeled I, II and III) are primers used for standard PCR. Primer sequences are shown in Table S1. (B) The presence of ψDbf410 in the HeLa S3, HEK293 and 293T cell lines was confirmed by PCR-based mapping. Reactions were carried out using genomic DNA isolated from each cell line and the primers indicated (I to III). PCR products were separated by 1% agarose-gel electrophoresis. “L” and “NTC” denote DNA size ladder and no-template-control, respectively. PCR templates were isolated from cell lines indicated. HL denotes HeLa S3 cells. (C) Analysis of replication initiation at the ψDbf410. Nascent strand abundance assays were carried out with 1 SYMBOL 0150 /* MERGEFORMAT 2 kb newly synthesized single-stranded DNA templates isolated from asynchronous HeLa S3 cells and qPCR primer pairs shown (primer positions are shown in Fig. 2A). Relative sequence abundance was calculated using Prom3 sequence on chromosome 7 as reference.Citation39 The DNA segments amplified by Prom7B and HS(A) primer sets represent, respectively, replication initiation zones I and II at the Dbf4 origin locus (which is missing in ψDbf410),Citation39 and the region amplified by the primer sets Chr10 UPS is unique to ψDbf410. * denotes that enrichment of nascent strands at both Prom7B and HS(A) are significantly higher than the Chr10UPS, p < 0.05 for both (*** p < 0.001 for Prom7B) according to Dunnett's test with Chr10 UPS as control. (1-way ANOVA, p = 0.0003, F = 6.521, df = 26).

Figure 6. Nucleosomes within the human Dbf4 origin region, but not those at corresponding locations relative to the Dbf4 pseudogene on chromosome 10 (ψDbf4), are subject to both acetylation and trimethylation on lysine 9 of histone H3 (H3K9ac and H3K9me3, respectively). (A) A schematic representation of corresponding primer locations at the human Dbf4 origin-promoter locus on chromosome 7 and the upstream of ψDbf4 ATG site on chromosome 10. For chromosome 7, shaded gray boxes represent replication initiation zones I and II, spotted rectangle represents Dbf4 exon 1, and black rectangle Dbf4 intron 1. For chromosome 10, shaded gray rectangles represent the first 3 Dbf4 exons located within the ψDbf4 region. The diagram shows from position 87,504,848 to 87,506,448 of chromosome 7, and from position 65,599,419 to 65,601,019 of chromosome 10. (B) The presence of histone H3 at Dbf4 origin and corresponding regions relative to ATG position at ψDbf4. ChIP was carried out in asynchronous HeLa S3 cells with an antibody specific for histone H3. The resultant pull-down DNA was subjected to quantification by qPCR, and normalized to total H3 ChIP values. (C) The presence of histone H3 post-translational modifications (left panel: H3K9ac; right panel: H3K9me3) at the Dbf4 origin (black) and at corresponding regions relative to ATG position at ψDbf4 (white). ChIP was carried out on asynchronous HeLa S3 cells with antibodies specific for H3K9ac or H3K9me3; pull-down DNA was subjected to quantification by qPCR, and normalized to total H3 ChIP values. Values represent mean ± SEM, n = 2. *P < 0.05; **P < 0.01 relative to corresponding primer set at Dbf4 pseudogene.
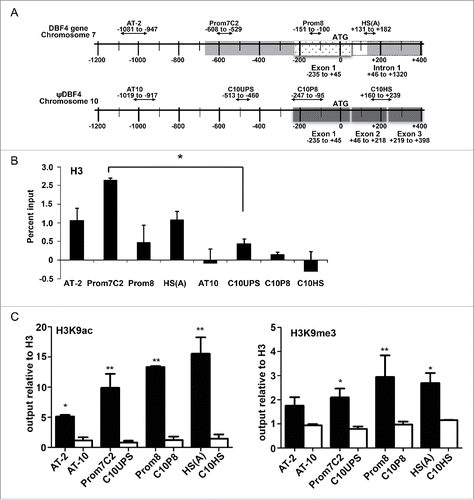
Figure 6. Nucleosomes within the human Dbf4 origin region, but not those at corresponding locations relative to the Dbf4 pseudogene on chromosome 10 (ψDbf4), are subject to both acetylation and trimethylation on lysine 9 of histone H3 (H3K9ac and H3K9me3, respectively). (A) A schematic representation of corresponding primer locations at the human Dbf4 origin-promoter locus on chromosome 7 and the upstream of ψDbf4 ATG site on chromosome 10. For chromosome 7, shaded gray boxes represent replication initiation zones I and II, spotted rectangle represents Dbf4 exon 1, and black rectangle Dbf4 intron 1. For chromosome 10, shaded gray rectangles represent the first 3 Dbf4 exons located within the ψDbf4 region. The diagram shows from position 87,504,848 to 87,506,448 of chromosome 7, and from position 65,599,419 to 65,601,019 of chromosome 10. (B) The presence of histone H3 at Dbf4 origin and corresponding regions relative to ATG position at ψDbf4. ChIP was carried out in asynchronous HeLa S3 cells with an antibody specific for histone H3. The resultant pull-down DNA was subjected to quantification by qPCR, and normalized to total H3 ChIP values. (C) The presence of histone H3 post-translational modifications (left panel: H3K9ac; right panel: H3K9me3) at the Dbf4 origin (black) and at corresponding regions relative to ATG position at ψDbf4 (white). ChIP was carried out on asynchronous HeLa S3 cells with antibodies specific for H3K9ac or H3K9me3; pull-down DNA was subjected to quantification by qPCR, and normalized to total H3 ChIP values. Values represent mean ± SEM, n = 2. *P < 0.05; **P < 0.01 relative to corresponding primer set at Dbf4 pseudogene.

Figure 7. Post-translational modification of histone H3 on lysine 9 is cell cycle-regulated at the Dbf4 origin locus. (A) Shown is the presence of the H3K9ac histone H3 post-translational modifications at Dbf4 origin and non-origin loci in the function of cell cycle positions. Net output values were determined by subtracting output value recovered by an anti-H3K9ac antibody at a non-nucleosomal locus (i.e., Prom4 primer set) from nucleosome-containing primer sets, HS(A) (black bar) and Prom3 (white bar) representing Dbf4 origin and non-origin, respectively. (B) The presence of the H3K9me3 histone H3 post-translational modifications at Dbf4 origin and non-origin loci in the function of cell cycle positions. Values are calculated as in A. Values represent mean ± SD, n = 3. *P < 0.05; **P < 0.01 relative to Prom3 at each time point.
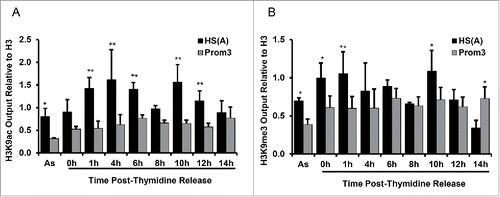
Figure 7. Post-translational modification of histone H3 on lysine 9 is cell cycle-regulated at the Dbf4 origin locus. (A) Shown is the presence of the H3K9ac histone H3 post-translational modifications at Dbf4 origin and non-origin loci in the function of cell cycle positions. Net output values were determined by subtracting output value recovered by an anti-H3K9ac antibody at a non-nucleosomal locus (i.e., Prom4 primer set) from nucleosome-containing primer sets, HS(A) (black bar) and Prom3 (white bar) representing Dbf4 origin and non-origin, respectively. (B) The presence of the H3K9me3 histone H3 post-translational modifications at Dbf4 origin and non-origin loci in the function of cell cycle positions. Values are calculated as in A. Values represent mean ± SD, n = 3. *P < 0.05; **P < 0.01 relative to Prom3 at each time point.

Figure 8. KDM4A and HP1γ are cell cycle-regulated at the Dbf4 origin-promoter locus. (A) KDM4A was within the Dbf4 origin region at G1/S and mid-S. ChIP was carried out with HeLa S3 cell with an antibody specific for KDM4A. The resultant pull-down DNA was then quantified by qPCR. Net output was determined by amount of DNA enriched, less background. Values represent mean ± SD, n = 2. (B) HP1γ is enriched at the Dbf4 origin locus for a short period after replication. Note that HS(A) and Prom2 represent origin and non-origin, respectively. Values were obtained as in panel A. Net output was determined by the amount of DNA enriched, less background. Values represent mean ± SD, n = 3 (* = p < 0.05).
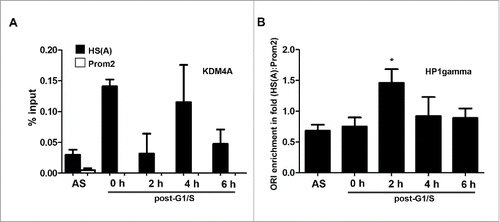
Figure 8. KDM4A and HP1γ are cell cycle-regulated at the Dbf4 origin-promoter locus. (A) KDM4A was within the Dbf4 origin region at G1/S and mid-S. ChIP was carried out with HeLa S3 cell with an antibody specific for KDM4A. The resultant pull-down DNA was then quantified by qPCR. Net output was determined by amount of DNA enriched, less background. Values represent mean ± SD, n = 2. (B) HP1γ is enriched at the Dbf4 origin locus for a short period after replication. Note that HS(A) and Prom2 represent origin and non-origin, respectively. Values were obtained as in panel A. Net output was determined by the amount of DNA enriched, less background. Values represent mean ± SD, n = 3 (* = p < 0.05).
Supplemental material

Supplemental Files

Download PDF (197.8 KB)

Reprints and Corporate Permissions

Please note: Selecting permissions does not provide access to the full text of the article, please see our help page How do I view content?

To request a reprint or corporate permissions for this article, please click on the relevant link below:

Academic Permissions

Please note: Selecting permissions does not provide access to the full text of the article, please see our help page How do I view content?

Obtain permissions instantly via Rightslink by clicking on the button below:

If you are unable to obtain permissions via Rightslink, please complete and submit this Permissions form. For more information, please visit our Permissions help page.