1,729
Views
6
CrossRef citations to date
0
Altmetric
Extra View

TEAD activity is restrained by MYC and stratifies human breast cancer subtypes

, , &
Pages 2551-2556 | Received 23 Mar 2016, Accepted 26 Jun 2016, Published online: 02 Sep 2016

Figures & data

Figure 1. MYC restrains TEAD-dependent YAP functions. A: Workflow for the RNA-Sequencing experiment performed in FACS-sorted HMLE cells expressing a doxycycline-inducible HA-MYC allele (pInducer21-HA-MYC). B: Gene set enrichment analysis for the C3 gene set (motifs) in the CD44high/CD24low HMLE population 8 hours after MYC induction. MYC and MYCMAX represent potential binding sites for the MYC/MAX heterodimer, whereas TEF1 represents predicted binding sites for TEAD1 (also called TEF1). NES = normalized enrichment score; FDR = false discovery rate. C: CD44high/CD24low HMLE cells were infected with the indicated YAP 5SA mutants (YAP 5SA or the TEAD-binding compromised YAP 5SA S94A mutant) and analyzed by immunoblots. VINCULIN served as a loading control. D: qRT-PCR analyses of the direct YAP/TAZ target genes ANKRD1 and CTGF, as well as additional genes (BDNF, ARHGAP29 and RAB30) from the WGGAATGY_V$TEF1_Q6 C3 gene set. E: qChIP analysis in MCF7 cells for TEAD binding to the promoters of the given genes. IgG served as a negative control. Ctrl region = U2 promoter region.
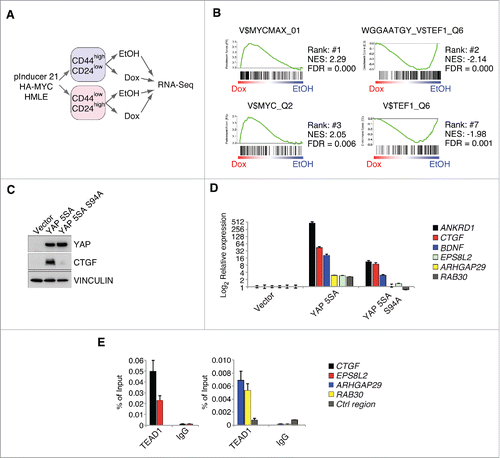
Figure 1. MYC restrains TEAD-dependent YAP functions. A: Workflow for the RNA-Sequencing experiment performed in FACS-sorted HMLE cells expressing a doxycycline-inducible HA-MYC allele (pInducer21-HA-MYC). B: Gene set enrichment analysis for the C3 gene set (motifs) in the CD44high/CD24low HMLE population 8 hours after MYC induction. MYC and MYCMAX represent potential binding sites for the MYC/MAX heterodimer, whereas TEF1 represents predicted binding sites for TEAD1 (also called TEF1). NES = normalized enrichment score; FDR = false discovery rate. C: CD44high/CD24low HMLE cells were infected with the indicated YAP 5SA mutants (YAP 5SA or the TEAD-binding compromised YAP 5SA S94A mutant) and analyzed by immunoblots. VINCULIN served as a loading control. D: qRT-PCR analyses of the direct YAP/TAZ target genes ANKRD1 and CTGF, as well as additional genes (BDNF, ARHGAP29 and RAB30) from the WGGAATGY_V$TEF1_Q6 C3 gene set. E: qChIP analysis in MCF7 cells for TEAD binding to the promoters of the given genes. IgG served as a negative control. Ctrl region = U2 promoter region.

Figure 2. MYC and TEAD activity stratify human breast cancer patients. A: Association score analysis for MYC target genes and TEAD target genes (C3 WGGAATGY_V$TEF1_Q6 gene set) in the METABRIC or TCGA breast cancer data sets, respectively. The association score for the expression of MYC and TEAD target genes was calculated for every single patient and subsequently sorted according to the MYC association score. A negative association score describes the repression of the respective gene set, whereas a positive association score describes an induction of the respective gene set in the respective patient compared to the median. A color code is given to annotate the grade (METABRIC) or subtype (TCGA) per patient. LumA = Luminal A; LumB = Luminal B; Her2 = Her2-amplified. B: Spearman rank correlation and associated significance test for the correlation between MYC and TEAD activity as determined in A. C: Patients from the TCGA data set were stratified according to their association score (AS) for MYC and TEAD, respectively. The prevalence of breast cancer subtypes within the given groups is depicted as a piechart. MYC high: AS > −2; MYC low: AS ≤ −2; TEAD high: AS > 3; TEAD low: AS ≤ 3. LumA = Luminal A; LumB = Luminal B; Her2 = Her2-amplified. n denotes the number of patients per piechart. Please note that the breast cancer subtype information was not available for every patient in the TCGA data set. D: Kaplan-Meier plot for patients with a Luminal A subtype. The patients were stratified according to their TEAD activity (TEAD score > 0 ; TEAD score < 0, respectively) and analyzed for their disease-specific survival. The p-value was determined by a chi-square test.
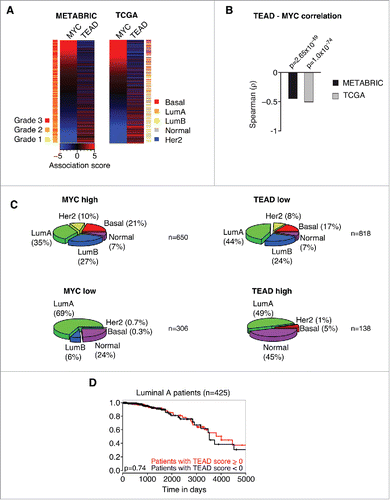
Figure 2. MYC and TEAD activity stratify human breast cancer patients. A: Association score analysis for MYC target genes and TEAD target genes (C3 WGGAATGY_V$TEF1_Q6 gene set) in the METABRIC or TCGA breast cancer data sets, respectively. The association score for the expression of MYC and TEAD target genes was calculated for every single patient and subsequently sorted according to the MYC association score. A negative association score describes the repression of the respective gene set, whereas a positive association score describes an induction of the respective gene set in the respective patient compared to the median. A color code is given to annotate the grade (METABRIC) or subtype (TCGA) per patient. LumA = Luminal A; LumB = Luminal B; Her2 = Her2-amplified. B: Spearman rank correlation and associated significance test for the correlation between MYC and TEAD activity as determined in A. C: Patients from the TCGA data set were stratified according to their association score (AS) for MYC and TEAD, respectively. The prevalence of breast cancer subtypes within the given groups is depicted as a piechart. MYC high: AS > −2; MYC low: AS ≤ −2; TEAD high: AS > 3; TEAD low: AS ≤ 3. LumA = Luminal A; LumB = Luminal B; Her2 = Her2-amplified. n denotes the number of patients per piechart. Please note that the breast cancer subtype information was not available for every patient in the TCGA data set. D: Kaplan-Meier plot for patients with a Luminal A subtype. The patients were stratified according to their TEAD activity (TEAD score > 0 ; TEAD score < 0, respectively) and analyzed for their disease-specific survival. The p-value was determined by a chi-square test.

Reprints and Corporate Permissions

Please note: Selecting permissions does not provide access to the full text of the article, please see our help page How do I view content?

To request a reprint or corporate permissions for this article, please click on the relevant link below:

Academic Permissions

Please note: Selecting permissions does not provide access to the full text of the article, please see our help page How do I view content?

Obtain permissions instantly via Rightslink by clicking on the button below:

If you are unable to obtain permissions via Rightslink, please complete and submit this Permissions form. For more information, please visit our Permissions help page.