Figures & data
Figure 1. Cell cultures of Muse cells and MSCs. The figure shows representative fields of cell cultures from which we collected secretomes. Black bar represents 100 microns.
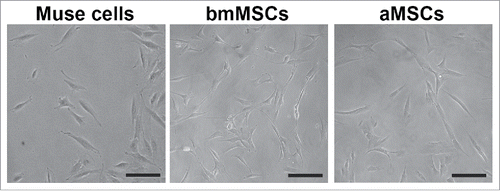
Table 1. Panther GO ontologies found in the secretome of Muse cells, bmMSCs and aMSCs. In the table are reported ontologies belonging to “biological process” and “molecular function” classes, which are in common among the 3 cell types we analyzed.
Figure 2. Overlapping networks. 159 canonical pathways were in common among Muse cells, bmMSCs and aMSCs. We determined for each cell type which of these belonged to overlapping networks. The picture shows overlapping networks in Muse cells (A), in bmMSCs (B) and aMSCs (C).
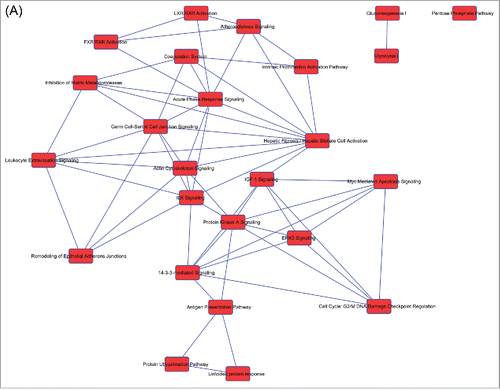
Figure 2. (Continued).
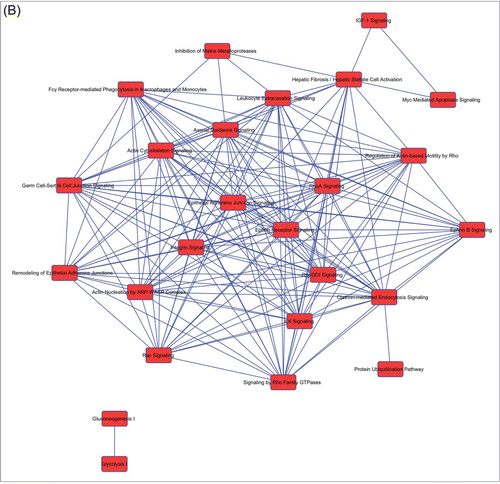
Figure 2. (Continued).
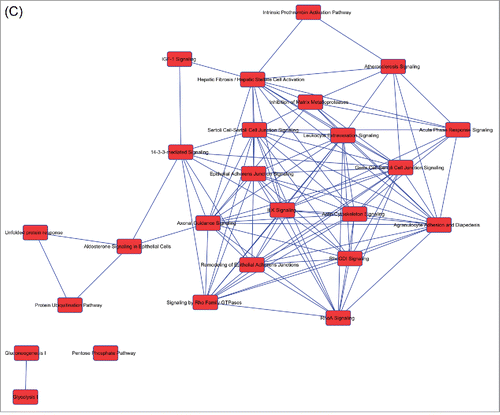
Table 2. List of canonical pathways present in overlapping networks. Some canonical pathways were in the overlapping networks of the 3 cell types, while others were exclusively present in Muse cells. For each cell type the presence of a canonical pathway in overlapping networks is indicated with X.
Table 3. Common and Muse cells specific upstream regulators.
Figure 3. Muse cells canonical pathways in overlapping networks. The figure shows the canonical pathways of Muse cells, which belongs to overlapping networks. Proteins of Muse cells secretome for each canonical pathway are depicted.
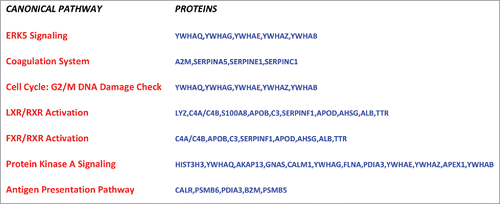
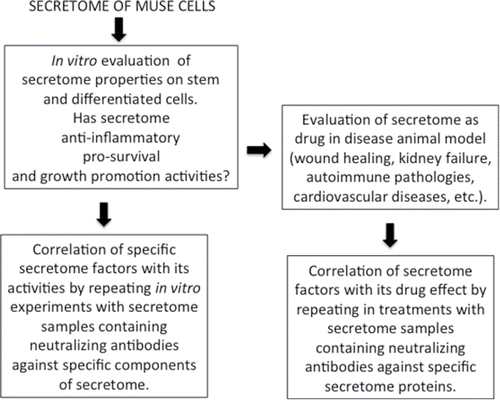
Figure 4. Experimental plan. Suggested experimental plan to identify the role of specific factors present in cells' secretome.