1,231
Views
12
CrossRef citations to date
0
Altmetric
Report

Mammary epithelial morphogenesis and early breast cancer. Evidence of involvement of basal components of the RNA Polymerase I transcription machinery

, &
Pages 2515-2526 | Received 02 Mar 2016, Accepted 15 Jul 2016, Published online: 15 Aug 2016

Figures & data

Figure 1. The basal components of the RNA-polymerase I (Pol I) transcription machinery. The assembly of the Pol I transcription machinery onto the ribosomal gene (rDNA) promoter and the initiation of rDNA transcription into pre-rRNA (subsequently processed into mature rRNAs) require several transcription factors and auxiliary proteins (left), many of which are specific to Pol I (right).
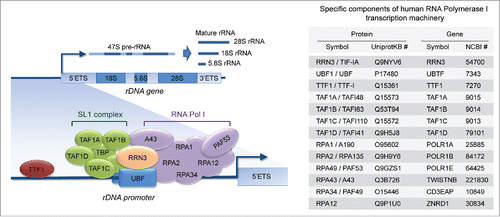
Figure 1. The basal components of the RNA-polymerase I (Pol I) transcription machinery. The assembly of the Pol I transcription machinery onto the ribosomal gene (rDNA) promoter and the initiation of rDNA transcription into pre-rRNA (subsequently processed into mature rRNAs) require several transcription factors and auxiliary proteins (left), many of which are specific to Pol I (right).

Figure 2. Amplification/upregulation of basal components of the Pol I transcription machinery in invasive breast cancer. (A) TCGA analysis shows that genes encoding for basal components of the Pol I transcription machinery are frequently altered in invasive breast carcinoma. (B) Most of the altered genes are amplified and/or upregulated (left); almost half of these cases show concomitant amplification/upregulation of 2 or more genes (right). (C) Patients with amplification/upregulation of at least 1 (left) or at least 2 (right) genes encoding for basal components of the Pol I machinery have a significantly worse prognosis than patients with no alterations in these genes.
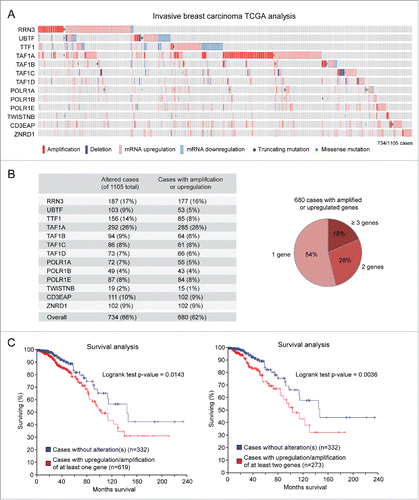
Figure 2. Amplification/upregulation of basal components of the Pol I transcription machinery in invasive breast cancer. (A) TCGA analysis shows that genes encoding for basal components of the Pol I transcription machinery are frequently altered in invasive breast carcinoma. (B) Most of the altered genes are amplified and/or upregulated (left); almost half of these cases show concomitant amplification/upregulation of 2 or more genes (right). (C) Patients with amplification/upregulation of at least 1 (left) or at least 2 (right) genes encoding for basal components of the Pol I machinery have a significantly worse prognosis than patients with no alterations in these genes.

Figure 3. Detection of genomic gain of basal components of the Pol I transcription machinery in early breast cancer lesions. (A-B) Analysis of published data setsCitation13-16 shows that genes encoding for basal components of the Pol I transcription machinery are frequently amplified in ADH and pure DCIS (A) as well as in matched DCIS/IDC pairs (B).
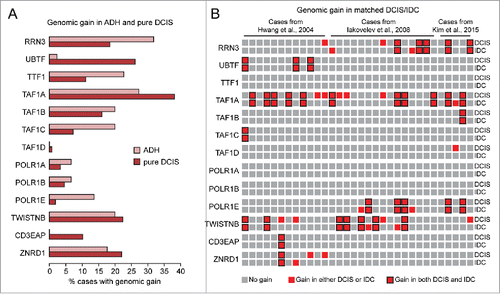
Figure 3. Detection of genomic gain of basal components of the Pol I transcription machinery in early breast cancer lesions. (A-B) Analysis of published data setsCitation13-16 shows that genes encoding for basal components of the Pol I transcription machinery are frequently amplified in ADH and pure DCIS (A) as well as in matched DCIS/IDC pairs (B).

Figure 4. RRN3 knock down in MCF7 breast cancer cells leads to decreased rRNA transcription and inhibition of cell proliferation. (A) RRN3 mRNA level (left) is significantly higher in breast cancer cell lines (yellow) relative to HME1 mammary epithelial cells (gray), and correlates with increased rRNA transcription (assessed as pre-rRNA level) (right). (B) Transient transfection of MCF7 with RRN3 siRNA (10 nM, 48h) decreases RRN3 mRNA (left, top), RRN3 protein (left, bottom), and RRN3 nucleolar accumulation (right) relative to cells transfected with a negative control scrambled sequence (siCtrl). (C-D) RRN3 knock down significantly reduces both rRNA synthesis (assessed by pre-rRNA qRT-PCR) (C) and cell proliferation (assessed by EdU incorporation) (D). * = p < 0.05; ** = p < 0.01; *** p < 0.001.
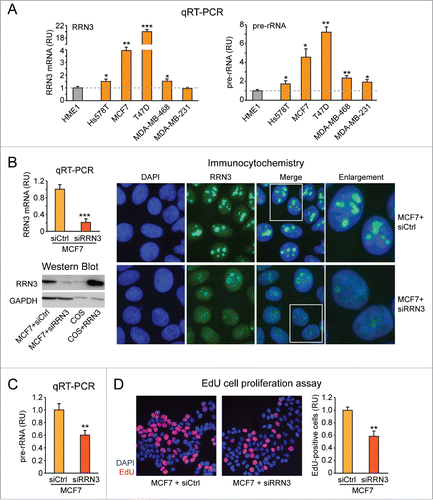
Figure 4. RRN3 knock down in MCF7 breast cancer cells leads to decreased rRNA transcription and inhibition of cell proliferation. (A) RRN3 mRNA level (left) is significantly higher in breast cancer cell lines (yellow) relative to HME1 mammary epithelial cells (gray), and correlates with increased rRNA transcription (assessed as pre-rRNA level) (right). (B) Transient transfection of MCF7 with RRN3 siRNA (10 nM, 48h) decreases RRN3 mRNA (left, top), RRN3 protein (left, bottom), and RRN3 nucleolar accumulation (right) relative to cells transfected with a negative control scrambled sequence (siCtrl). (C-D) RRN3 knock down significantly reduces both rRNA synthesis (assessed by pre-rRNA qRT-PCR) (C) and cell proliferation (assessed by EdU incorporation) (D). * = p < 0.05; ** = p < 0.01; *** p < 0.001.

Figure 5. Ectopic expression of RRN3 in HME1 cells promotes rRNA synthesis and confers increased sensitivity to the anti-proliferative action of the Pol I inhibitor CX-5461. (A) Quantitative Western blot (blot shown at top left, quantification shown at bottom left) and immunocytochemistry (right) show that RRN3 protein expression in HME1 cells stably transfected with RRN3 (here shown a representative clone, HME1-RRN3-1) is higher relative to control HME1 cells transfected with the cognate empty vector (HME1-Ctrl), but similar to the RRN3 protein expression level of MCF7 breast cancer cells. (B) RRN3 overexpression leads to increased rRNA synthesis (assessed by pre-rRNA qRT-PCR) in 2 HME1-RRN3 clones relative to HME1-Ctrl cells. (C) MTT assay shows that the Pol I inhibitor CX-5461, which selectively inhibits Pol I transcription by disrupting the formation of the Pol I pre-initiation complex (left), inhibits proliferation of HME1-RRN3 cells at lower concentrations relative to HME1-Ctrl cells (right). (D) EdU incorporation assay further shows that 10 nM CX-5461 reduces the number of HME1-RRN3 cells in S phase (EdU-positive cells) while it does not affect HME1-Ctrl cells. * = p < 0.05; ** = p < 0.01.
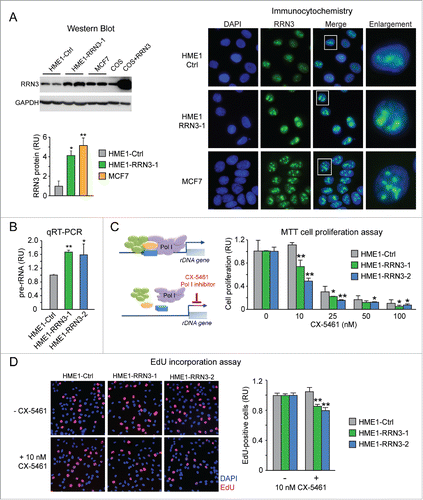
Figure 5. Ectopic expression of RRN3 in HME1 cells promotes rRNA synthesis and confers increased sensitivity to the anti-proliferative action of the Pol I inhibitor CX-5461. (A) Quantitative Western blot (blot shown at top left, quantification shown at bottom left) and immunocytochemistry (right) show that RRN3 protein expression in HME1 cells stably transfected with RRN3 (here shown a representative clone, HME1-RRN3-1) is higher relative to control HME1 cells transfected with the cognate empty vector (HME1-Ctrl), but similar to the RRN3 protein expression level of MCF7 breast cancer cells. (B) RRN3 overexpression leads to increased rRNA synthesis (assessed by pre-rRNA qRT-PCR) in 2 HME1-RRN3 clones relative to HME1-Ctrl cells. (C) MTT assay shows that the Pol I inhibitor CX-5461, which selectively inhibits Pol I transcription by disrupting the formation of the Pol I pre-initiation complex (left), inhibits proliferation of HME1-RRN3 cells at lower concentrations relative to HME1-Ctrl cells (right). (D) EdU incorporation assay further shows that 10 nM CX-5461 reduces the number of HME1-RRN3 cells in S phase (EdU-positive cells) while it does not affect HME1-Ctrl cells. * = p < 0.05; ** = p < 0.01.

Figure 6. Stable RRN3-induced rRNA upregulation impairs 3D HME1 mammary epithelial morphogenesis. Confocal analysis shows that HME1-Ctrl cells develop into morphologically normal acinar structures in 3-dimensional (3D) culture (left), while HME1-RRN3-1 and HME1-RRN3-2 clones, overexpressing RRN3, mostly form amorphous 3D acini characterized by partially, or completely, filled lumen and presence of proliferating cells (right). DAPI (blue) identifies nuclei, while Golgi apparatus (red)/integrin (green) staining detects cell polarity. Nuclei of proliferating cells were identified by EdU staining (red).
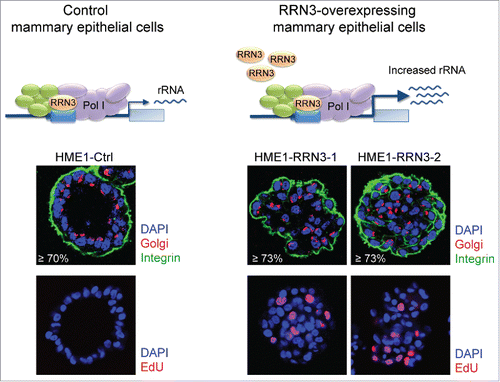
Figure 6. Stable RRN3-induced rRNA upregulation impairs 3D HME1 mammary epithelial morphogenesis. Confocal analysis shows that HME1-Ctrl cells develop into morphologically normal acinar structures in 3-dimensional (3D) culture (left), while HME1-RRN3-1 and HME1-RRN3-2 clones, overexpressing RRN3, mostly form amorphous 3D acini characterized by partially, or completely, filled lumen and presence of proliferating cells (right). DAPI (blue) identifies nuclei, while Golgi apparatus (red)/integrin (green) staining detects cell polarity. Nuclei of proliferating cells were identified by EdU staining (red).

Figure 7. Basal components of the Pol I transcription machinery are amplified/upregulated in cancers of different histotype. TCGA analysis shows that genes encoding for basal components of the Pol I transcription machinery are frequently amplified/upregulated in different cancer types (see Results and Methods for details).
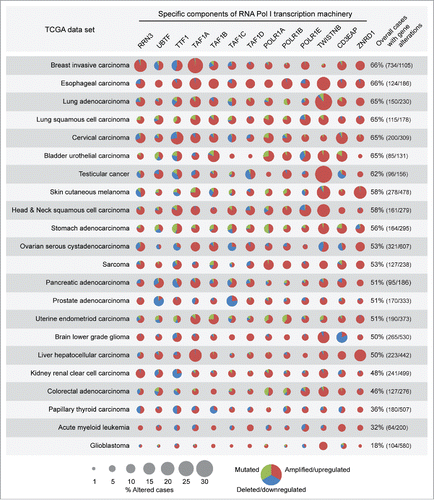
Figure 7. Basal components of the Pol I transcription machinery are amplified/upregulated in cancers of different histotype. TCGA analysis shows that genes encoding for basal components of the Pol I transcription machinery are frequently amplified/upregulated in different cancer types (see Results and Methods for details).

Reprints and Corporate Permissions

Please note: Selecting permissions does not provide access to the full text of the article, please see our help page How do I view content?

To request a reprint or corporate permissions for this article, please click on the relevant link below:

Academic Permissions

Please note: Selecting permissions does not provide access to the full text of the article, please see our help page How do I view content?

Obtain permissions instantly via Rightslink by clicking on the button below:

If you are unable to obtain permissions via Rightslink, please complete and submit this Permissions form. For more information, please visit our Permissions help page.