Figures & data
Figure 1. Analysis of extracellular medium acidification. (A) Immunoblot assays were performed to visualize the different transgenes as expressed by NIH 3T3 cells. The antibodies used were anti-GFP to detect GFP and HDAC4-GFP, anti-H-RAS, and anti-Actin as a loading control. (B) Growth in soft agar of NIH-3T3 cells expressing the indicated transgenes. 1 × 10⁵ cells/plate were seeded and foci were MTT-stained 21 days later. n = 3; ± SD. (C) Representative soft-agar assay as performed in A). (D) Analysis of acidification in the extracellular medium. The different cell lines were grown for 8 days and the pH of the extracellular medium monitored at the indicated times. n = 3; ± SD. (E) Analysis of lactate concentration in the extracellular medium. The different cell lines were grown for 2 days and the concentration of lactate measured as described in material and methods and normalized for cell numbers. n = 4; ± SD. (F) Resazurin assay was performed as described in material and methods. The different cell lines were treated with the indicated concentration of oxamate for 48 h and the IC50 calculated. n = 7; ± SD. (G) Oxamate IC50 for each cell line calculated as described in Materials and Methods from experiments illustrated in F. *= p < 0.05; **= p < 0.01; ***= p < 0.001 t-test statistics.
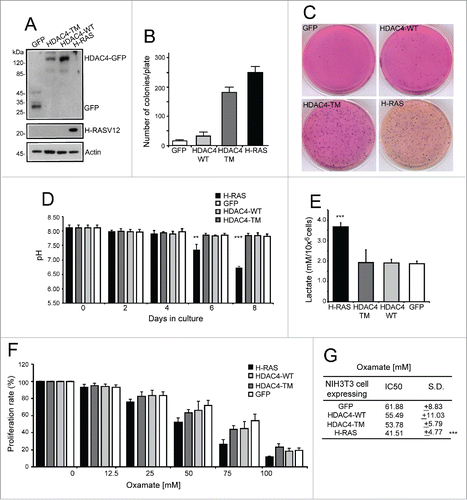
Figure 2. Glycolysis inhibition differentially impacts HDAC4/TM and RAS-transformed cells. (A) Differential sensibility to glucose shortage of the 4 cell lines. 1 × 10⁵ cells/plate were seeded and after 24 h the cells were maintained in DMEM containing 25 mM glucose or shifted to DMEM containing 5,56 mM glucose for 72 h and counted every 24 h; n = 3 ± SD. (B) Analysis of cell death at the indicated times in the 4 cell lines. 1 × 10⁵ cells/plate were seeded and after 24 h the cells were maintained in DMEM containing 25 mM glucose or shifted to DMEM containing 5,56 mM glucose for 72 h. n = 3 ± SD. (C) Resazurin assay of the cell lines treated with different 2-DG concentrations for 48 h; n = 3 ± SD. (D) 2-DG IC50 for each cell line calculated as described in Materials and Methods. (E) Cell count after 48 h treatment with 2-DG at 5 mM (left) and 25 mM (right); n = 3 ± SD. (F) Intracellular ATP content of the 4 cell lines treated for 1 h with 2-DG 25 mM; n = 3 ± SD. *= p < 0.05; **= p < 0.01; ***= p < 0.001 t-test statistics.
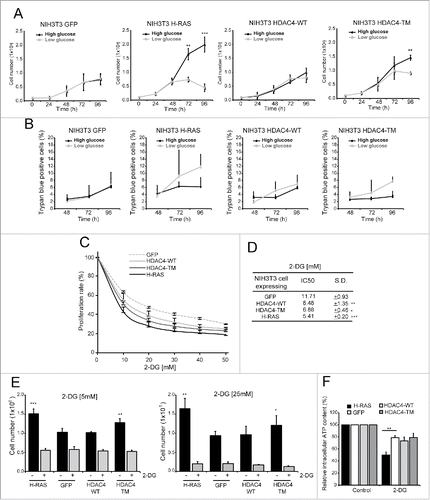
Figure 3. HDAC4/TM overexpression does not alter mitochondrial metabolic functionality. (A) Oxygen consumption rates were measured in intact cells grown in complete medium with 25mM glucose. Metabolic states: basal routine respiration, R; non-phosphorylating respiration, L (measured in the presence of 2.5 µg/mL oligomycin); maximal respiration, E (measured in the presence of 3.3 µM FCCP). n = 4 ± SD *p < 0.05, **p < 0.01 and ***p < 0.005 compared with GFP-expressing cells. (B) The phosphorylating respiration R-L was calculated as the difference between the routine and the “proton leak” respiration. The normalized respiratory flux control ratios were calculated: R/E as the ratio between the routine and the maximal respiration, and (R-L)/E as the ratio between the phosphorylating and the maximal respiration. n = 4 ± SD. *p < 0.05 compared with GFP-expressing cells. (C) Relative mitochondrial DNA content quantified by RT-PCR. The DNA sequences coding for the NADH dehydrogenase subunit ND4 and for the ATP6 subunit of the ATP synthase were chosen as representative of mitochondrial DNA, whereas β2-microglobulin gene was used for genomic DNA normalization, n = 3 ± SD. (D) Mitochondrial membrane potential in intact cells, cultured in 25 mM glucose, measured by cytofluorimetric analysis after mitochondrial staining with 200 nM TMRM. Data are reported as mean fluorescence of stained population. n = 3 ± SD. (E) The different cells, cultured in 25 mM glucose and treated or not with oligomycin (2 µM) and rotenone (1 µM) as indicated, were in vivo stained with TMRM (200nM) and then analyzed by FACS. Data are reported as mean fluorescence of stained population. n =3 ± SD. (F) Relative electron transport system complex I activity biochemically determined as reported in the Materials and Methods section; n = 3 ± SD. (G) Representative immunoblot of complex I protein level. Densitometric analysis is also provided (n = 2 ± SD). *= p < 0.05; **= p < 0.01; ***= p < 0.001 t-test statistics. NS (non-statistically significant).
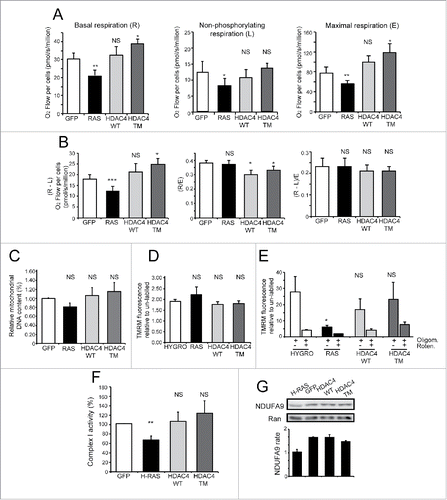
Table 1. Enrichment Scores (ES) obtained through a GSEA analysis. Two comparisons were made: GFP vs HDAC4/TM and HYGRO vs RAS. ns means not significant ES, with a p > 0.05.
Table 2. The number of MSigDB genesets that for each category (rows) are significantly enriched in one of the 4 classes, analyzed as in .
Figure 4. Transcriptional reprogramming correlates with metabolic adaptations. (A) Boxplots illustrating the mRNA levels of 39 genes involved in glycolysis, 17 in TCA cycle, 92 in mitochondrial respiration and oxidative phosphorylation and 33 in fatty acid β-oxidation and lipolysis in RAS and HDAC4/TM expressing cells. In each case the levels are expressed as fold relative to control. (B) Boxplots illustrating the mRNA levels in RAS and HDAC4/TM expressing cells of the genes that define 3 categories: leading edge (L.E.) lipid metabolism; L.E. glycolysis; L.E. MEF2-targets, defined after a leading edge analysis as explained in the text and in material and methods. *p < 0.05, **p < 0.01, Mann-Whitney test of significance.
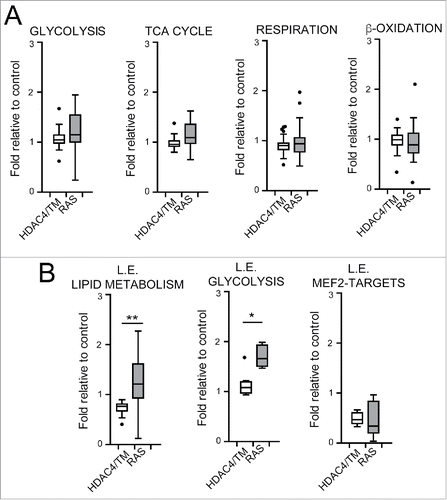
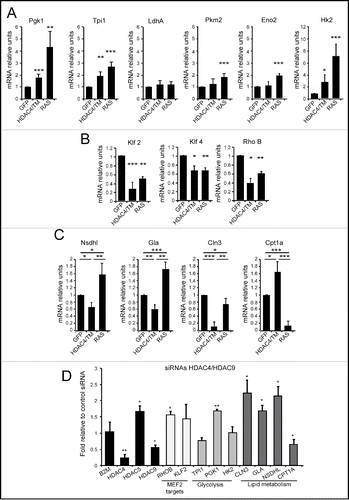
Figure 5. Differential expression of metabolic genes in RAS and HDAC4/TM transformed cells. (A) The mRNA expression levels for 6 selected genes of the glycolysis (Pgk1,Tpi1, LdhA, Pkm2, Eno2, Hk2) were measured in NIH 3T3 expressing the different transgenes, using qRT-PCR. (B) The mRNA expression levels for 3 selected MEF2-target genes (Klf2, Klf4, RhoB) were measured in NIH 3T3 expressing the different transgenes, using qRT-PCR. (C) The mRNA expression levels for 3 selected genes of the lipid metabolism category (Nsdhl, Gla, Cln3, Cpt1a) were measured in NIH 3T3 expressing the different transgenes, using qRT-PCR. (D) MCF7 cells co-transfected with siRNAs against HDAC4, and HDAC9 or with the same amount of a control siRNA were lysed, and mRNAs were extracted. Fold induction was calculated as the ratio relative to control siRNA-transfected cells.