Figures & data
Figure 1. Ablation of cyclin A2 in erythroid cells in vivo using erythropoietin receptor promoter-driven Cre leads to defective erythropoiesis. (A) Complete blood count data from cyclin A2fl/fl ErGFPcre mice (A2 KO, red dots, n = 11) and littermate controls (Control, blue dots, n = 9) at 3 months of age. (B-C) May-Grünwald Giemsa stained blood smears. Scale bar = 10µm. Arrows indicate erythrocytes with Howell-Jolly bodies. (D) 3D reconstruction of erythrocyte volume using z-stacks from confocal microscopy of blood smears stained with fluorescence-labeled PKH26. Representative wild-type erythrocytes (left panel, blue, inset density diagram in the middle); A2 KO (middle panel, red, inset density diagram in the middle [yellow plane indicates the cut of the inset]; and merge (right panel, inset representing 3D-view); indicating the difference in volume between wild-type and A2 KO erythrocytes. (E-F) Representative flow cytometry analysis plots of peripheral blood from age-matched control (top) and A2 KO (bottom) mice stained with antibodies against TER119 and CD71, and Hoechst33342 (n = 3). The percentage of TER119+ erythrocytes with nuclear remnants (Howell-Jolly bodies, HJ) is indicated in panel E. CD71 versus Hoechst plots for TER119+-gated peripheral blood cells with the frequencies of CD71+Hoechst− reticulocytes (RET) and CD71−Hoechst+ erythrocytes with Howell-Jolly bodies (HJ) are shown in panel F. (G) Bar graphs representing flow cytometry quantification of the percentage of erythrocytes containing Howell-Jolly bodies (HJ) in peripheral blood gated as shown in panel E, and the percentage of reticulocytes (RET) in TER119+-gated peripheral blood cells gated as shown in panel F (n = 3). (H) The mean forward scatter values of TER119+Hoechst−CD71 erythrocytes (RBC, red bars), TER119+Hoechst−CD71+ reticulocytes (RET, green bars), and TER119+Hoechst+CD71 Howell-Jolly bodies (HJ, blue bar) in the peripheral blood, gated as shown in panel F (n = 3). The forward scatter histogram overlays are shown in Figure S1C. Error bars represent standard deviation. Two-tailed t-test results are indicated by asterisks. *, p < 0.05; **, p < 0.01; ***, p < 0.001.
![Figure 1. Ablation of cyclin A2 in erythroid cells in vivo using erythropoietin receptor promoter-driven Cre leads to defective erythropoiesis. (A) Complete blood count data from cyclin A2fl/fl ErGFPcre mice (A2 KO, red dots, n = 11) and littermate controls (Control, blue dots, n = 9) at 3 months of age. (B-C) May-Grünwald Giemsa stained blood smears. Scale bar = 10µm. Arrows indicate erythrocytes with Howell-Jolly bodies. (D) 3D reconstruction of erythrocyte volume using z-stacks from confocal microscopy of blood smears stained with fluorescence-labeled PKH26. Representative wild-type erythrocytes (left panel, blue, inset density diagram in the middle); A2 KO (middle panel, red, inset density diagram in the middle [yellow plane indicates the cut of the inset]; and merge (right panel, inset representing 3D-view); indicating the difference in volume between wild-type and A2 KO erythrocytes. (E-F) Representative flow cytometry analysis plots of peripheral blood from age-matched control (top) and A2 KO (bottom) mice stained with antibodies against TER119 and CD71, and Hoechst33342 (n = 3). The percentage of TER119+ erythrocytes with nuclear remnants (Howell-Jolly bodies, HJ) is indicated in panel E. CD71 versus Hoechst plots for TER119+-gated peripheral blood cells with the frequencies of CD71+Hoechst− reticulocytes (RET) and CD71−Hoechst+ erythrocytes with Howell-Jolly bodies (HJ) are shown in panel F. (G) Bar graphs representing flow cytometry quantification of the percentage of erythrocytes containing Howell-Jolly bodies (HJ) in peripheral blood gated as shown in panel E, and the percentage of reticulocytes (RET) in TER119+-gated peripheral blood cells gated as shown in panel F (n = 3). (H) The mean forward scatter values of TER119+Hoechst−CD71 erythrocytes (RBC, red bars), TER119+Hoechst−CD71+ reticulocytes (RET, green bars), and TER119+Hoechst+CD71 Howell-Jolly bodies (HJ, blue bar) in the peripheral blood, gated as shown in panel F (n = 3). The forward scatter histogram overlays are shown in Figure S1C. Error bars represent standard deviation. Two-tailed t-test results are indicated by asterisks. *, p < 0.05; **, p < 0.01; ***, p < 0.001.](/cms/asset/1d230bb1-caa8-4212-83a0-1469f61ed987/kccy_a_1234546_f0001_c.gif)
Figure 2. Analysis of erythropoiesis in cyclin A2fl/fl ErGFPcre mice. (A-B) Hematoxylin and Eosin stained sections of control (A) and A2 KO (B) bone marrow from 12 weeks old mice. Scale bar = 100µm. (C) Absolute cell counts per femur for 12 weeks old mice (n = 3). (D-E) Staining of spleen sections from 12 weeks old control (C) and A2 KO (D) mice with antibodies against Ki-67. Scale bar = 1 mm. (F) The percentage of TER119+Ki-67+ cells in the spleen of 10 weeks old mice measured by flow cytometry (n = 3). (G) Weight of spleen of 12 weeks old A2 KO mice (n = 7) and their littermate controls (n = 6). (H) Hematocrit recovery kinetics after PHZ treatments for A2 KO mice (n = 7) and their littermate controls (n = 6). (I-J) Frequency of CD71hiTER119lo pro-erythroblasts [pro-E], TER119hiCD71hiFSChi basophilic erythroblast (EryB), TER119hiCD71hiFSClo polychromatic erythroblast (EryP) and TER119hiCD71loFSClo orthochromatic erythroblast (EryO) in bone marrow (I) and spleen (J) (n = 3). (K) Western blot analysis of total fetal liver cells isolated from A2 KO or littermate control E13.5 mouse embryos using the indicated antibodies. Hsp90 served as loading control. (L-O) Flow cytometry analysis of E13.5 fetal liver erythropoiesis. (L) Representative flow cytometry analysis plots showing the percentage of enucleated erythroid cells (ENU) and TER119+ cells containing Howell-Jolly bodies (HJ) in E13.5 fetal livers (n = 4). (M) The cell size distribution of enucleated E13.5 fetal liver erythroblasts (ENU, gated as shown in panel L) is indicated by the forward scatter histogram overlays (n = 4). (N) Bar graphs representing the percentage of enucleated erythroblasts (ENU) in E13.5 fetal livers (n = 4), gated as shown in panel L. (O) Bar graphs representing the percentage of erythroblasts containing Howell-Jolly bodies (HJ) in E13.5 fetal livers (n = 4), gated as shown in panel L. (P) The percentage of BrdU+ cells among CD71+TER119+ erythroblasts in E13.5 fetal livers (n = 4). (Q) Purified TER119-negative fetal liver erythroblasts were labeled with PKH26 dye and cultured for 48 hours. Representative PKH26 staining histogram overlays at 0 h (D0 PKH26) and 48 h (D2 PKH26) in culture are shown (n = 3). Error bars represent standard deviation. Two-tailed t-test results are indicated by asterisks. *, p < 0.05; **, p < 0.01; ***, p < 0.001.
![Figure 2. Analysis of erythropoiesis in cyclin A2fl/fl ErGFPcre mice. (A-B) Hematoxylin and Eosin stained sections of control (A) and A2 KO (B) bone marrow from 12 weeks old mice. Scale bar = 100µm. (C) Absolute cell counts per femur for 12 weeks old mice (n = 3). (D-E) Staining of spleen sections from 12 weeks old control (C) and A2 KO (D) mice with antibodies against Ki-67. Scale bar = 1 mm. (F) The percentage of TER119+Ki-67+ cells in the spleen of 10 weeks old mice measured by flow cytometry (n = 3). (G) Weight of spleen of 12 weeks old A2 KO mice (n = 7) and their littermate controls (n = 6). (H) Hematocrit recovery kinetics after PHZ treatments for A2 KO mice (n = 7) and their littermate controls (n = 6). (I-J) Frequency of CD71hiTER119lo pro-erythroblasts [pro-E], TER119hiCD71hiFSChi basophilic erythroblast (EryB), TER119hiCD71hiFSClo polychromatic erythroblast (EryP) and TER119hiCD71loFSClo orthochromatic erythroblast (EryO) in bone marrow (I) and spleen (J) (n = 3). (K) Western blot analysis of total fetal liver cells isolated from A2 KO or littermate control E13.5 mouse embryos using the indicated antibodies. Hsp90 served as loading control. (L-O) Flow cytometry analysis of E13.5 fetal liver erythropoiesis. (L) Representative flow cytometry analysis plots showing the percentage of enucleated erythroid cells (ENU) and TER119+ cells containing Howell-Jolly bodies (HJ) in E13.5 fetal livers (n = 4). (M) The cell size distribution of enucleated E13.5 fetal liver erythroblasts (ENU, gated as shown in panel L) is indicated by the forward scatter histogram overlays (n = 4). (N) Bar graphs representing the percentage of enucleated erythroblasts (ENU) in E13.5 fetal livers (n = 4), gated as shown in panel L. (O) Bar graphs representing the percentage of erythroblasts containing Howell-Jolly bodies (HJ) in E13.5 fetal livers (n = 4), gated as shown in panel L. (P) The percentage of BrdU+ cells among CD71+TER119+ erythroblasts in E13.5 fetal livers (n = 4). (Q) Purified TER119-negative fetal liver erythroblasts were labeled with PKH26 dye and cultured for 48 hours. Representative PKH26 staining histogram overlays at 0 h (D0 PKH26) and 48 h (D2 PKH26) in culture are shown (n = 3). Error bars represent standard deviation. Two-tailed t-test results are indicated by asterisks. *, p < 0.05; **, p < 0.01; ***, p < 0.001.](/cms/asset/e7b6322c-380c-412e-aa5c-a7b40371619c/kccy_a_1234546_f0002_c.gif)
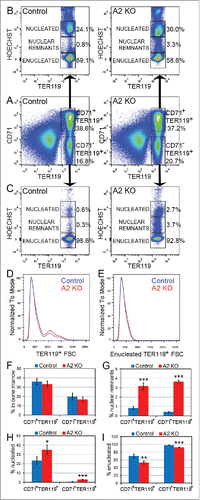
Figure 3. Defective nuclear extrusion in cyclin A2fl/fl ErGFPcre bone marrow erythroblasts. Freshly isolated bone marrow cells from A2 KO (n = 4) and littermate control mice (n = 3) were stained with antibodies against CD71 and TER119, as well as Hoechst33342, and analyzed by flow cytometry. Representative flow cytometry plots are shown. (A) The gating and frequencies of CD71+TER119+ and CD71−TER119+ erythroblast subpopulations are shown. (B) Gated CD71+TER119+ erythroblasts were resolved into enucleated, nucleated, and nuclear remnants-containing populations based on Hoechst staining, and their respective frequencies are shown. (C) Gated CD71−TER119+ erythroblasts were resolved into enucleated, nucleated, and nuclear remnants-containing populations based on Hoechst staining, and their respective frequencies are shown. (D) The cell size distribution of TER119+ bone marrow erythroblasts is indicated by the forward scatter histogram. (E) The cell size distribution of enucleated TER119+ bone marrow erythroblasts is indicated by the forward scatter histogram. (F) Bar graphs representing the percentages of the CD71+TER119+ and CD71−TER119+ erythroblast subpopulations in the bone marrow, gated as shown in panel A. (G) Bar graphs representing the percentages of the CD71+TER119+ and CD71−TER119+ erythroblast subpopulations that contain nuclear remnants, gated as shown in panels B and C. (H) Bar graphs representing the percentages of the CD71+TER119+ and CD71−TER119+ erythroblast subpopulations that are nucleated, gated as shown in panels B and C. (I) Bar graphs representing the percentages of the CD71+TER119+ and CD71−TER119+ erythroblast subpopulations that are enucleated, gated as shown in panels B and C. Error bars represent standard deviation. Two-tailed t-test results are indicated by asterisks. *, p < 0.05; **, p < 0.01; ***, p < 0.001.

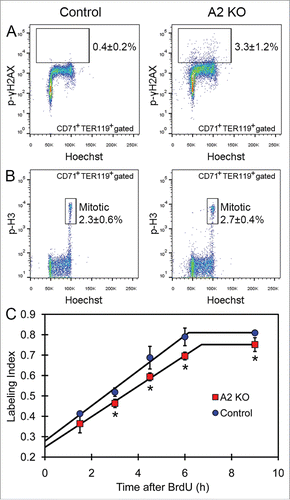
Figure 4. Analysis of DNA damage and cell cycle in cyclin A2fl/fl ErGFPcre bone marrow erythroblasts. (A) The percentage of phospho-gamma-H2AX-positive cells in the gated CD71+TER119+ erythroblasts in bone marrow from A2 KO and age-matched control mice, indicated as average ± standard deviation (n = 7). (B) The percentage of mitotic (phospho-histone-H3; p-H3high) cells in the gated CD71+TER119+ erythroblasts in bone marrow from A2 KO and age-matched control mice, indicated as average ± standard deviation (n = 5). (C) The plot of BrdU labeling index of CD71+ bone marrow erythroblasts vs. the cumulative BrdU labeling time are shown for A2 KO mice and age-matched wild-type control mice (n = 3 mice per time point). Error bars represent standard deviation. Two-tailed t-test results are indicated by asterisks. *, p < 0.05; **, p < 0.01; ***, p < 0.001.

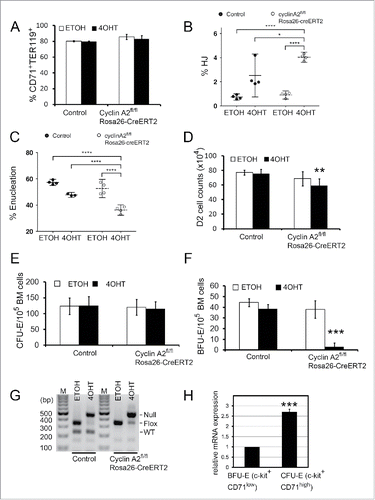
Figure 5. Induction of cyclin A2 loss in erythroid progenitors in culture. (A-F) Whole bone marrow cells were isolated from cyclin A2fl/fl Rosa26-CreERT2 mice, or wild-type control mice, followed by lineage-depletion of the differentiated cell types. The Lin− bone marrow erythroblasts were cultured for 48 hours in erythropoietin-containing medium with 100 nM 4-hydroxytamoxifen (4OHT) or empty vehicle control (EtOH), followed by cell counting and FACS analysis. (A) Flow cytometry analysis of erythroid differentiation at 48 hours in culture by quantifying the CD71+TER119+ population, which represents the late stage erythroid cells. (B-C) Flow cytometry analysis of reticulocytes with nuclear remnants (HJ, B) and enucleated reticulocytes (Enu, C) at 48 hours in culture. (D) Total cell counts at 48 hours in culture for an equal starting cell number (10Citation5) of Lin− bone marrow erythroblasts. (E-F) Whole bone marrow cells were isolated from cyclin A2fl/flRosa26-CreERT2 mice (n = 5), or control mice (n = 4) consisting of wild type or cyclin A2+/fl Rosa26-CreERT2 mice, and 100,000 cells were plated in colony formation medium with 100 nM 4-hydroxytamoxifen (4OHT) or empty vehicle control (EtOH). CFU-E (E) and BFU-E (F) colony counts are shown. (G) Genotyping PCR performed on colonies pooled from entire plates after colony counts as shown in panels E and F. (H) Quantitative real-time PCR analysis of cyclin A2 mRNA expression on populations enriched for BFU-E (c-kit+CD71low) and CFU-E (c-kit+CD71high) purified from wild-type mice bone marrow (n = 3). Error bars represent standard deviation. Paired two-tailed t-test results are indicated by asterisks. *, p < 0.05; **, p < 0.01; ***, p < 0.001; ****, p < 0.0001. In B-C, we used a one-way ANOVA with alpha = 5.000% and the graphs show the mean with 95% confidence interval.

Figure 6. Cdk2fl/fl cyclin A2fl/fl ErGFPcre mice display erythroid phenotypes similar to cyclin A2fl/fl ErGFPcre mice. (A) Complete blood count data from Cdk2fl/fl cyclin A2fl/fl ErGFPcre mice (A2 K2 DKO, red dots, n = 7) and aged matched wild-type control mice (Control, blue dots, n = 6). (B-C) Frequency of CD71hiTER119lo pro-erythroblasts [pro-E], TER119hiCD71hiFSChi basophilic erythroblast (EryB), TER119hiCD71hiFSClo polychromatic erythroblast (EryP) and TER119hiCD71loFSClo orthochromatic erythroblast (EryO) in bone marrow (B) and spleen (C) (n = 3). (D) Hematocrit recovery kinetics after PHZ treatments for A2 K2 DKO mice (n = 8) and their littermate controls (n = 8). Error bars represent standard deviation. Two-tailed t-test results are indicated by asterisks. *, p < 0.05; **, p < 0.01; ***, p < 0.001.
![Figure 6. Cdk2fl/fl cyclin A2fl/fl ErGFPcre mice display erythroid phenotypes similar to cyclin A2fl/fl ErGFPcre mice. (A) Complete blood count data from Cdk2fl/fl cyclin A2fl/fl ErGFPcre mice (A2 K2 DKO, red dots, n = 7) and aged matched wild-type control mice (Control, blue dots, n = 6). (B-C) Frequency of CD71hiTER119lo pro-erythroblasts [pro-E], TER119hiCD71hiFSChi basophilic erythroblast (EryB), TER119hiCD71hiFSClo polychromatic erythroblast (EryP) and TER119hiCD71loFSClo orthochromatic erythroblast (EryO) in bone marrow (B) and spleen (C) (n = 3). (D) Hematocrit recovery kinetics after PHZ treatments for A2 K2 DKO mice (n = 8) and their littermate controls (n = 8). Error bars represent standard deviation. Two-tailed t-test results are indicated by asterisks. *, p < 0.05; **, p < 0.01; ***, p < 0.001.](/cms/asset/7aeb9b7a-0490-4236-b3ed-29b2499f96b7/kccy_a_1234546_f0006_c.gif)
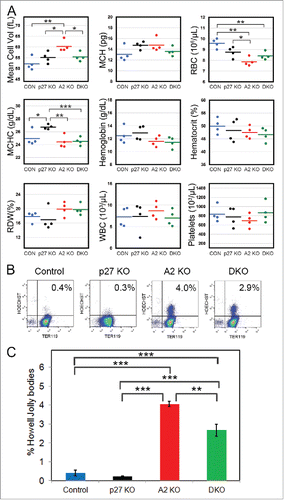
Figure 7. Loss of p27 ameliorates the defects in cyclin A2fl/fl ErGFPcre mice. (A) Complete blood count data from age-matched cyclin A2fl/fl p27−/− ErGFPcre mice (DKO, green dots, n = 4), cyclin A2fl/fl ErGFPcre mice (A2 KO, red dots, n = 4), p27−/− mice (p27 KO, black dots, n = 4), and wild-type control mice (Control, blue dots, n = 4). (B-C) Flow cytometry analysis of Howell-Jolly bodies in peripheral blood of mice with the indicated genotypes (n = 3). The representative FACS plots (B) and the Bar graphs (C) are shown. Error bars represent standard deviation. Two-tailed t-test results are indicated by asterisks. *, p < 0.05; **, p < 0.01; ***, p < 0.001.

