2,833
Views
22
CrossRef citations to date
0
Altmetric
Report

The eIF2A knockout mouse

, , , , , , & show all
Pages 3115-3120 | Received 26 Aug 2016, Accepted 08 Sep 2016, Published online: 01 Nov 2016

Figures & data

Figure 1. The eIF2A gene. (A) Top: Mus musculus eukaryotic translation initiation factor 2A (eIF2A) (mouse Accession: NM_001005509) gene organization and the site of insertion of Omnibank Vector 74. Bottom: Mouse genomic sequence surrounding the gene trap insertion site identified in the C57BL/6 gene trap ES cell clone IST13504C3sA4 for eIF2A. The initiating ATG codon is in red and the coding part of exon 1 is in cyan. The insertion site is denoted with an asterisk *. (B) Top: Schematic of the insertion site and the genotyping strategy. Relative positions of the primers and the expected sizes of the PCR fragments are indicated. Bottom: Genotyping results (1.5% agarose gel).
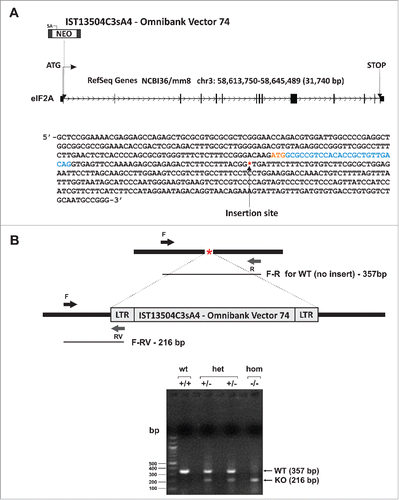
Figure 1. The eIF2A gene. (A) Top: Mus musculus eukaryotic translation initiation factor 2A (eIF2A) (mouse Accession: NM_001005509) gene organization and the site of insertion of Omnibank Vector 74. Bottom: Mouse genomic sequence surrounding the gene trap insertion site identified in the C57BL/6 gene trap ES cell clone IST13504C3sA4 for eIF2A. The initiating ATG codon is in red and the coding part of exon 1 is in cyan. The insertion site is denoted with an asterisk *. (B) Top: Schematic of the insertion site and the genotyping strategy. Relative positions of the primers and the expected sizes of the PCR fragments are indicated. Bottom: Genotyping results (1.5% agarose gel).

Figure 2. The eIF2A gene expression. (A) Real-time PCR. Relative Ct values are shown; Ct values were normalized to gapdh signal and are shown relative to wild-type brain sample. Two sets of primers were used: Primer set 1, recognizing sequences within exons 1 and 2 (top) and primer set 2 recognizing sequences within exons 8 and 9 (bottom). (B) Western blotting. mRNA and protein levels were analyzed in 6 different mouse tissues heart, brain, lung, liver, kidney and pancreas, respectively.
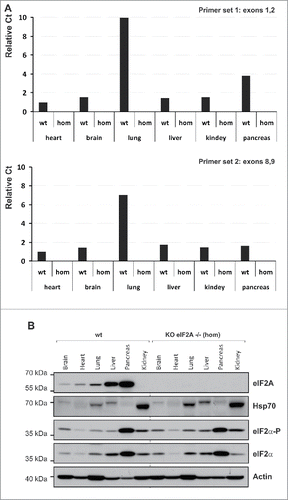
Figure 2. The eIF2A gene expression. (A) Real-time PCR. Relative Ct values are shown; Ct values were normalized to gapdh signal and are shown relative to wild-type brain sample. Two sets of primers were used: Primer set 1, recognizing sequences within exons 1 and 2 (top) and primer set 2 recognizing sequences within exons 8 and 9 (bottom). (B) Western blotting. mRNA and protein levels were analyzed in 6 different mouse tissues heart, brain, lung, liver, kidney and pancreas, respectively.
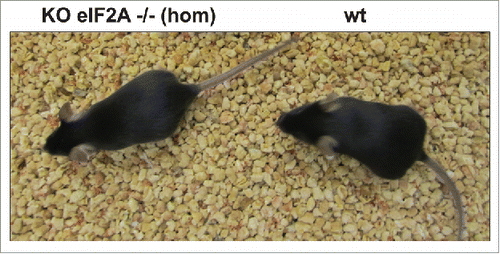
Figure 3. The eIF2A knockout mouse. Mouse with knockout eIF2A gene (left) and mouse with normal gene (right). Both mice are similar in size and morphology and reveal no detectable difference in their phenotype.

Figure 3. The eIF2A knockout mouse. Mouse with knockout eIF2A gene (left) and mouse with normal gene (right). Both mice are similar in size and morphology and reveal no detectable difference in their phenotype.

Reprints and Corporate Permissions

Please note: Selecting permissions does not provide access to the full text of the article, please see our help page How do I view content?

To request a reprint or corporate permissions for this article, please click on the relevant link below:

Academic Permissions

Please note: Selecting permissions does not provide access to the full text of the article, please see our help page How do I view content?

Obtain permissions instantly via Rightslink by clicking on the button below:

If you are unable to obtain permissions via Rightslink, please complete and submit this Permissions form. For more information, please visit our Permissions help page.