1,298
Views
3
CrossRef citations to date
0
Altmetric
Reports

GAK is phosphorylated by c-Src and translocated from the centrosome to chromatin at the end of telophase

, , , , , , & show all
Pages 415-427 | Received 06 Jul 2016, Accepted 21 Sep 2016, Published online: 02 Feb 2017

Figures & data

Figure 1. GAK is phosphorylated by c-Src in vitro. (A) GAK showed a band shift (arrowhead) during M phase when the cell cycle of HeLa S3 cells was synchronized by nocodazole (prometaphase; 40 ng/mL for 18 h) or taxol (meta/anaphase; 33 nM for 18 h), but not when the cells were synchronized by thymidine (S phase; 2.5 mM for 24 h), mimosine (G1 phase; 0.5 μM for 24 h), or unsynchronized. (B) Wb analysis of phosphorylation modifications of endogenous GAK in HeLa S3 cells after taxol treatment using λ-phosphatase (PPase) alone or together with the phosphatase inhibitors sodium orthovanadate (Na3VO4), sodium fluoride (NaF), and β-glycerophosphate (β-gp). GAK was detected by the anti-GAK monoclonal antibody (9–10). The asterisk shows a putative band for non-phosphorylated GAK. Red arrow indicates a shifted band in the presence of λ-PPase. α-tubulin was detected as a loading control. (C) GAK was phosphorylated by c-Src, as detected by in vitro kinase assays. (i) A schematic representation of the GAK structure with functional domains and amino acid numbers. K, T, CB, and J denote the regions of GAK fragment proteins used as a substrate. The amino acid sequence around Y412 is also shown in red font. (ii) Radio-autograph of SDS-PAGE analysis after in vitro kinase assays of the K, T, CB, and J fragments using c-Src. Crimson and turquoise arrowheads indicate the phosphorylated and non-phosphorylated bands, respectively. The horizontal pink arrowhead indicates the band for auto-phosphorylation of c-Src protein. (iii) CBB staining of the same SDS-PAGE gel to show the existence of the band at the same location. (iv) Radio-autograph (left) and CBB staining (right) of SDS-PAGE gels after in vitro kinase assays of 2 narrowed-down fragments (see red arrows in ) of the CB region using c-Src. Crimson and turquoise arrowheads indicate the phosphorylated and non-phosphorylated bands, respectively. (v) A schematic representation of the sites (Y412 and Y1149) of GAK that are phosphorylated by c-Src to indicate their locations at a glance.
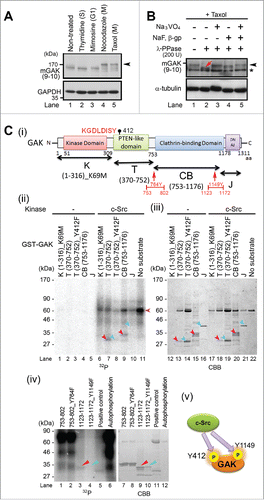
Figure 1. GAK is phosphorylated by c-Src in vitro. (A) GAK showed a band shift (arrowhead) during M phase when the cell cycle of HeLa S3 cells was synchronized by nocodazole (prometaphase; 40 ng/mL for 18 h) or taxol (meta/anaphase; 33 nM for 18 h), but not when the cells were synchronized by thymidine (S phase; 2.5 mM for 24 h), mimosine (G1 phase; 0.5 μM for 24 h), or unsynchronized. (B) Wb analysis of phosphorylation modifications of endogenous GAK in HeLa S3 cells after taxol treatment using λ-phosphatase (PPase) alone or together with the phosphatase inhibitors sodium orthovanadate (Na3VO4), sodium fluoride (NaF), and β-glycerophosphate (β-gp). GAK was detected by the anti-GAK monoclonal antibody (9–10). The asterisk shows a putative band for non-phosphorylated GAK. Red arrow indicates a shifted band in the presence of λ-PPase. α-tubulin was detected as a loading control. (C) GAK was phosphorylated by c-Src, as detected by in vitro kinase assays. (i) A schematic representation of the GAK structure with functional domains and amino acid numbers. K, T, CB, and J denote the regions of GAK fragment proteins used as a substrate. The amino acid sequence around Y412 is also shown in red font. (ii) Radio-autograph of SDS-PAGE analysis after in vitro kinase assays of the K, T, CB, and J fragments using c-Src. Crimson and turquoise arrowheads indicate the phosphorylated and non-phosphorylated bands, respectively. The horizontal pink arrowhead indicates the band for auto-phosphorylation of c-Src protein. (iii) CBB staining of the same SDS-PAGE gel to show the existence of the band at the same location. (iv) Radio-autograph (left) and CBB staining (right) of SDS-PAGE gels after in vitro kinase assays of 2 narrowed-down fragments (see red arrows in Fig. 1C-i) of the CB region using c-Src. Crimson and turquoise arrowheads indicate the phosphorylated and non-phosphorylated bands, respectively. (v) A schematic representation of the sites (Y412 and Y1149) of GAK that are phosphorylated by c-Src to indicate their locations at a glance.

Figure 2. Phosphorylation of GAK by c-Src occurs during M phase of the cell cycle in vivo. (A, B) Peptide dot blot analysis of the anti-GAK-pY412 (A) and anti-GAK-pY1149 (B) polyclonal antibodies generated using the KLH-conjugated phosphopeptides, namely, DLDISpYITSR for the anti-GAK-pY412 antibody and TQPRPNpYASNFSVI for the anti-GAK-pY1149 antibody. These antibodies recognized the phosphopeptides at the indicated concentrations more strongly than the non-phosphorylated peptide. (C) Treatment of HeLa S3 cells with Ki9 siRNA downregulated the protein levels of GAK, GAK-pY412 (arrow), and GAK-pY1149 (arrow), as detected by anti-GAK (9–10), anti-GAK-pY412, and anti-GAK-pY1149 antibodies, respectively. GL2 was the negative control siRNA. (D) The anti-GAK-pY412 antibody recognized the shifted band of GAK during M phase (arrows), which was detected after cell cycle synchronization of HeLa S cells using nocodazole (Noc; meta/anaphase) or taxol (Tax; prometaphase), but not by thymidine (Thy; S phase) or mimosine (Mim; G1 phase). NT, non-treated. MCM2 (S phase), cyclin B1 (M phase) and Aurora-A (M phase) proteins were detected to monitor cell cycle synchronization. (E) Phosphorylation of GAK at Y412 by c-Src peaks at 9 h (M phase of the cell cycle) in U2OS cells synchronized by TDBR, which was carried out by addition of 2.5 mM thymidine twice, followed by collection of cell extract at 3, 6, 9, 12, and 15 h after replacement of medium, according to the time schedule shown at the top panel. GAK-pY412 bands detected in the presence of the non-phosphopeptide (top panel) disappeared in the presence of the phosphopeptide (second panel). Aurora-B and cyclin B1 were detected to monitor the successful synchronization of the cell cycle. M phase cells accumulated at around 9 h after TDBR. Red arrowhead denotes a putative band for GAK-Y412 phosphorylated at a single site or non-phosphorylated form of GAK detected by anti-GAK-pY412 antibody (C, D, and E). α-tubulin was detected as a loading control (C, D, and E).
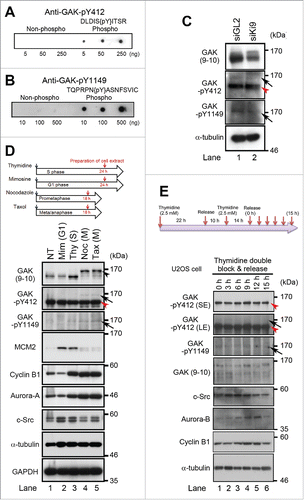
Figure 2. Phosphorylation of GAK by c-Src occurs during M phase of the cell cycle in vivo. (A, B) Peptide dot blot analysis of the anti-GAK-pY412 (A) and anti-GAK-pY1149 (B) polyclonal antibodies generated using the KLH-conjugated phosphopeptides, namely, DLDISpYITSR for the anti-GAK-pY412 antibody and TQPRPNpYASNFSVI for the anti-GAK-pY1149 antibody. These antibodies recognized the phosphopeptides at the indicated concentrations more strongly than the non-phosphorylated peptide. (C) Treatment of HeLa S3 cells with Ki9 siRNA downregulated the protein levels of GAK, GAK-pY412 (arrow), and GAK-pY1149 (arrow), as detected by anti-GAK (9–10), anti-GAK-pY412, and anti-GAK-pY1149 antibodies, respectively. GL2 was the negative control siRNA. (D) The anti-GAK-pY412 antibody recognized the shifted band of GAK during M phase (arrows), which was detected after cell cycle synchronization of HeLa S cells using nocodazole (Noc; meta/anaphase) or taxol (Tax; prometaphase), but not by thymidine (Thy; S phase) or mimosine (Mim; G1 phase). NT, non-treated. MCM2 (S phase), cyclin B1 (M phase) and Aurora-A (M phase) proteins were detected to monitor cell cycle synchronization. (E) Phosphorylation of GAK at Y412 by c-Src peaks at 9 h (M phase of the cell cycle) in U2OS cells synchronized by TDBR, which was carried out by addition of 2.5 mM thymidine twice, followed by collection of cell extract at 3, 6, 9, 12, and 15 h after replacement of medium, according to the time schedule shown at the top panel. GAK-pY412 bands detected in the presence of the non-phosphopeptide (top panel) disappeared in the presence of the phosphopeptide (second panel). Aurora-B and cyclin B1 were detected to monitor the successful synchronization of the cell cycle. M phase cells accumulated at around 9 h after TDBR. Red arrowhead denotes a putative band for GAK-Y412 phosphorylated at a single site or non-phosphorylated form of GAK detected by anti-GAK-pY412 antibody (C, D, and E). α-tubulin was detected as a loading control (C, D, and E).

Figure 3. Subcellular localizations of GAK, GAK-pY412, and GAK-pY1149. (A, B) Immunostaining of logarithmically growing HeLa S3 cells with the polyclonal anti-GAK-pY412 (A) and anti-GAK-pY1149 (B) antibodies. Typical IF images at interphase and M phase are arranged along the time sequence of cell cycle progression. Contrast-enhanced images of GAK-pY412 (A) and GAK-pY1149 (B) are also shown in the rightmost panels. Yellow arrowheads indicate the putative localizations of these signals at the centrosome. α-tubulin signals were observed to monitor the cell cycle stage. (C–F) Typical IF images at metaphase are shown, which were obtained by immunostaining HeLa S3 cells with anti-GAK-pY412 (C, F), anti-GAK-pY1149 (D, E), anti-γ-tubulin (C, D), and anti-GAK (9–10) antibodies (E, F). (A–F) DNA was counterstained with Hoechst 33258 to detect the localization of chromatin. Bars, 10 µm.
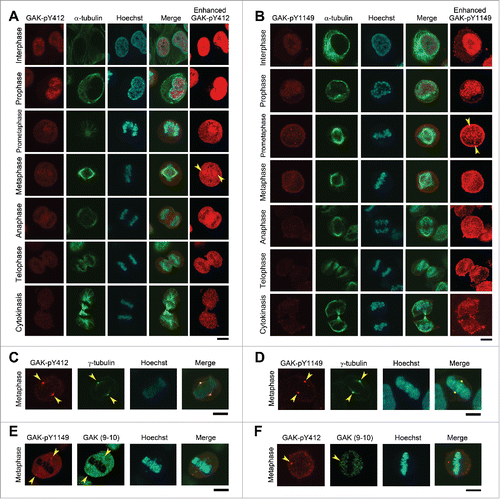
Figure 3. Subcellular localizations of GAK, GAK-pY412, and GAK-pY1149. (A, B) Immunostaining of logarithmically growing HeLa S3 cells with the polyclonal anti-GAK-pY412 (A) and anti-GAK-pY1149 (B) antibodies. Typical IF images at interphase and M phase are arranged along the time sequence of cell cycle progression. Contrast-enhanced images of GAK-pY412 (A) and GAK-pY1149 (B) are also shown in the rightmost panels. Yellow arrowheads indicate the putative localizations of these signals at the centrosome. α-tubulin signals were observed to monitor the cell cycle stage. (C–F) Typical IF images at metaphase are shown, which were obtained by immunostaining HeLa S3 cells with anti-GAK-pY412 (C, F), anti-GAK-pY1149 (D, E), anti-γ-tubulin (C, D), and anti-GAK (9–10) antibodies (E, F). (A–F) DNA was counterstained with Hoechst 33258 to detect the localization of chromatin. Bars, 10 µm.

Figure 4. GAK-Y1149F cells show a delay in S phase progression. (A) (i) Typical IF images, obtained by immunostaining with an anti-RPA70 antibody, of HeLa S3 cells expressing the vector alone (Vector), GAK-WT, GAK-Y1149F, or GAK-Y1149D in the presence of Dox at the indicated number of hours after TDBR treatment. (ii) Bar graphs showing the frequency (%) of HeLa S3 cells harboring more than 20 RPA70 dot signals. Green arrowheads highlight that GAK-Y1149F-expressing cells showed an increased frequency of RPA70-positive cells at 6, 9, and 12 h after TDBR treatment. (iii) Wb analysis indicates that the RPA70 level was unaltered and that the GAK-WT, GAK-Y1149F, and GAK-Y1149D proteins were successfully induced in the presence of Dox. α-tubulin was detected as a loading control. Bar, 10 µm. (B) The amount of newly synthesized DNA was reduced in Dox (+) GAK-Y1149F cells. (i) Typical images of Vector, GAK-WT, GAK-Y1149F, or GAK-Y1149D cells after incorporation of fluorescently labeled EdU in the presence (+) or absence (−) of Dox. Bar, 200 µm. (ii) Bar graphs showing the frequency (%) of the indicated HeLa S3 cells harboring more than 20 EdU dot signals. The difference between (−) and (+) red bars is statistically significant (P = 0.008).
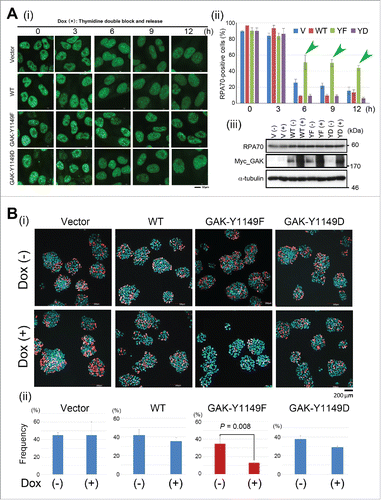
Figure 4. GAK-Y1149F cells show a delay in S phase progression. (A) (i) Typical IF images, obtained by immunostaining with an anti-RPA70 antibody, of HeLa S3 cells expressing the vector alone (Vector), GAK-WT, GAK-Y1149F, or GAK-Y1149D in the presence of Dox at the indicated number of hours after TDBR treatment. (ii) Bar graphs showing the frequency (%) of HeLa S3 cells harboring more than 20 RPA70 dot signals. Green arrowheads highlight that GAK-Y1149F-expressing cells showed an increased frequency of RPA70-positive cells at 6, 9, and 12 h after TDBR treatment. (iii) Wb analysis indicates that the RPA70 level was unaltered and that the GAK-WT, GAK-Y1149F, and GAK-Y1149D proteins were successfully induced in the presence of Dox. α-tubulin was detected as a loading control. Bar, 10 µm. (B) The amount of newly synthesized DNA was reduced in Dox (+) GAK-Y1149F cells. (i) Typical images of Vector, GAK-WT, GAK-Y1149F, or GAK-Y1149D cells after incorporation of fluorescently labeled EdU in the presence (+) or absence (−) of Dox. Bar, 200 µm. (ii) Bar graphs showing the frequency (%) of the indicated HeLa S3 cells harboring more than 20 EdU dot signals. The difference between (−) and (+) red bars is statistically significant (P = 0.008).

Figure 5. GAK associates with MCM3 and GAK-1149F cells show a reduced growth rate. (A, B) GAK associated with MCM3 (A), but not with c-Src (B), in U2OS cells. (C) Wb analysis shows that the band shift of MCM2 (red arrowheads) and the peak of the MCM3-pS112 band intensity (blue arrows) and the timing of its decrease (turquoise arrowheads) were delayed in Dox (+) GAK-Y1149F cells, but not in Vec-, GAK-WT-, and GAK-Y1149D-expressing cells (red and blue arrowheads), at around 9–12 h after TDBR treatment. The ORC2 level was almost unaltered, which served as a loading control. LE, long exposure; SE, short exposure. (D) Flow cytometry shows that the ratio between the G1 phase peak (black arrowheads) and the G2/M phase peak (gray arrowheads) was lowered in the following order: Vec > GAK-Y1149D > GAK-WT > GAK-Y1149F in the presence of Dox. (E) Cell cycle progression was delayed in Dox (+) GAK-Y1149F cells (green arrowhead) compared with Vec-, GAK-WT-, and GAK-Y1149D-expressing cells.
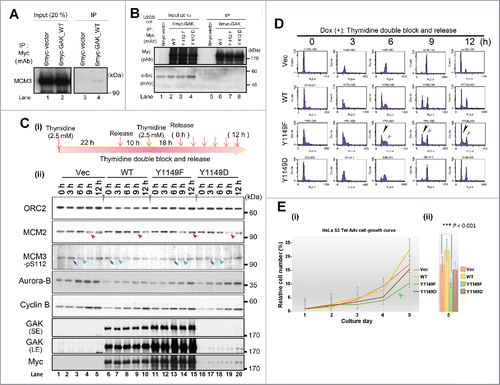
Figure 5. GAK associates with MCM3 and GAK-1149F cells show a reduced growth rate. (A, B) GAK associated with MCM3 (A), but not with c-Src (B), in U2OS cells. (C) Wb analysis shows that the band shift of MCM2 (red arrowheads) and the peak of the MCM3-pS112 band intensity (blue arrows) and the timing of its decrease (turquoise arrowheads) were delayed in Dox (+) GAK-Y1149F cells, but not in Vec-, GAK-WT-, and GAK-Y1149D-expressing cells (red and blue arrowheads), at around 9–12 h after TDBR treatment. The ORC2 level was almost unaltered, which served as a loading control. LE, long exposure; SE, short exposure. (D) Flow cytometry shows that the ratio between the G1 phase peak (black arrowheads) and the G2/M phase peak (gray arrowheads) was lowered in the following order: Vec > GAK-Y1149D > GAK-WT > GAK-Y1149F in the presence of Dox. (E) Cell cycle progression was delayed in Dox (+) GAK-Y1149F cells (green arrowhead) compared with Vec-, GAK-WT-, and GAK-Y1149D-expressing cells.

Figure 6. GAK-pY412, GAK-pY1149, ORC2, MCM2, and MCM3 translocate to chromatin at the end of telophase. (A–F) The subcellular localizations of GAK-pY412, GAK-pY1149, ORC2, MCM2, MCM3, and Lamin A/C during M phase are shown. Typical IF images are arranged along the time sequence of M phase progression. The yellow arrow (A-vi), white arrowheads (B-iii), green arrowheads (E-ii), and yellow arrowheads (F-ii) denote GAK-pY412 signals at interphase, GAK-pY1149 signals at the end of telophase, ORC2 signals at early anaphase, and the edge of the Lamin A/C envelope that was almost closed, respectively.
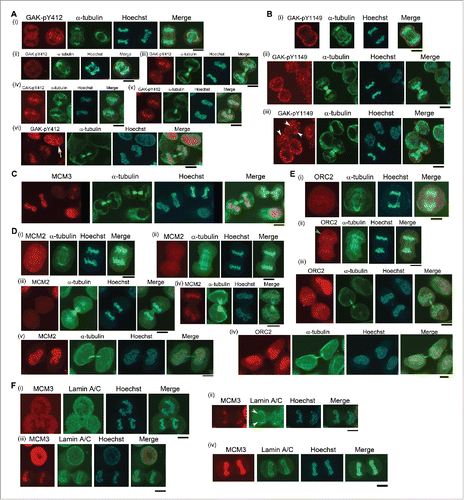
Figure 6. GAK-pY412, GAK-pY1149, ORC2, MCM2, and MCM3 translocate to chromatin at the end of telophase. (A–F) The subcellular localizations of GAK-pY412, GAK-pY1149, ORC2, MCM2, MCM3, and Lamin A/C during M phase are shown. Typical IF images are arranged along the time sequence of M phase progression. The yellow arrow (A-vi), white arrowheads (B-iii), green arrowheads (E-ii), and yellow arrowheads (F-ii) denote GAK-pY412 signals at interphase, GAK-pY1149 signals at the end of telophase, ORC2 signals at early anaphase, and the edge of the Lamin A/C envelope that was almost closed, respectively.

Figure 7. Subcellular localizations of GAK, GAK-pY412, and GAK-pY1149 in HeLa S3 cells expressing GAK-Y1149F proteins in the presence of Dox. Anti-GAK-pY412 polyclonal antibody, anti-GAK-pY1149 polyclonal antibody, anti-GAK polyclonal antibody (pGAK), anti-GAK monoclonal antibody (9–10), and anti-Myc (for Myc-GAK) monoclonal antibody were used for immunostaining. Contrast-enhanced images are also shown in the rightmost panels. Pink arrows indicate pY412 images in the nucleus. Pale green arrowheads emphasize the cytoplasmic signals of pY412, pY1149, Myc-GAK, pGAK, and GAK (9–10). Hoechst, Hoechst33258 used to detect DNA in the nucleus. Bar, 10 µm.
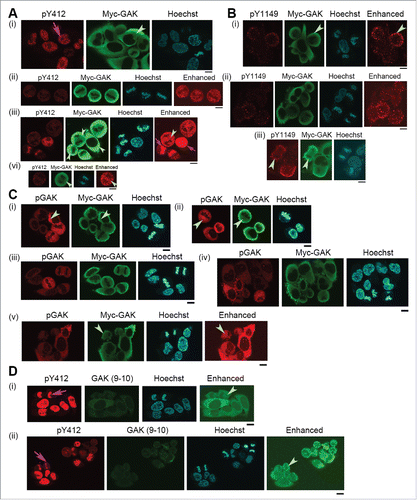
Figure 7. Subcellular localizations of GAK, GAK-pY412, and GAK-pY1149 in HeLa S3 cells expressing GAK-Y1149F proteins in the presence of Dox. Anti-GAK-pY412 polyclonal antibody, anti-GAK-pY1149 polyclonal antibody, anti-GAK polyclonal antibody (pGAK), anti-GAK monoclonal antibody (9–10), and anti-Myc (for Myc-GAK) monoclonal antibody were used for immunostaining. Contrast-enhanced images are also shown in the rightmost panels. Pink arrows indicate pY412 images in the nucleus. Pale green arrowheads emphasize the cytoplasmic signals of pY412, pY1149, Myc-GAK, pGAK, and GAK (9–10). Hoechst, Hoechst33258 used to detect DNA in the nucleus. Bar, 10 µm.
Supplemental material

Supplementary files

Download PDF (2.5 MB)

Reprints and Corporate Permissions

Please note: Selecting permissions does not provide access to the full text of the article, please see our help page How do I view content?

To request a reprint or corporate permissions for this article, please click on the relevant link below:

Academic Permissions

Please note: Selecting permissions does not provide access to the full text of the article, please see our help page How do I view content?

Obtain permissions instantly via Rightslink by clicking on the button below:

If you are unable to obtain permissions via Rightslink, please complete and submit this Permissions form. For more information, please visit our Permissions help page.