Figures & data
Figure 1. Haploinsufficient genes. Cell length at septation of heterozygous gene deletion mutants plotted as mean cell length with SEM. The green line shows the mean cell length of the control. n=>289 cells in at least 3 biological repeats.
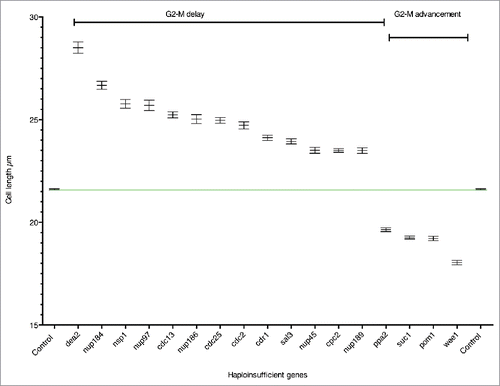
Table 1. Haploinsufficient gene set.
Figure 2. Functional groups and physical interactions for the HI genes. Evidence codes are orange edge = physical interaction, purple edge = within complex interaction, green edge = within pathway interaction, arrowhead = directed edge ie modification of a gene product by itself or another gene product, red edge = genetic interaction. Black arrows indicate genes involved in processes associated with more than one functional module. Gray filled circle = 10% gene set, unfilled circle = 8% gene set. The physical interactions were determined by esyN using Pombase high confidence interactions. The black boxes are the functional groups for the 10% gene set, the gray box is an additional functional group for the 8% gene set. This gene is also related to Regulation of the G2-M transition.
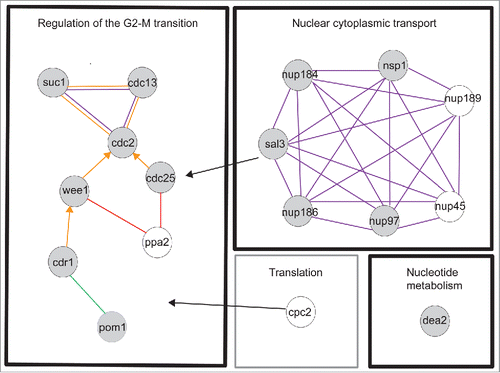
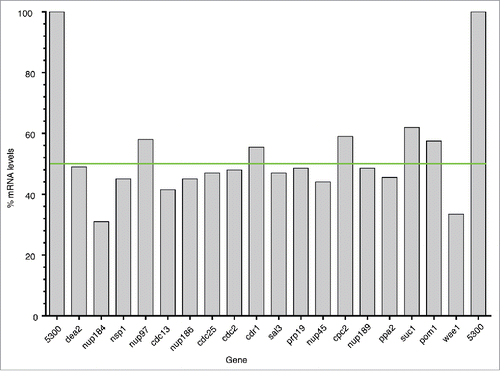
Figure 3. mRNA expression levels for the HI gene set. Graph showing the mRNA expression level for each the HI gene in the heterozygous deletion diploid strain compared to the homozygous control strain (100%) normalized to act1 mRNA. The green line denotes 50% of the control mRNA level.