2,329
Views
50
CrossRef citations to date
0
Altmetric
Report

Oxidative stress induced autophagy in cancer associated fibroblast enhances proliferation and metabolism of colorectal cancer cells

, , , , , , & show all
Pages 73-81 | Received 22 Jul 2016, Accepted 19 Oct 2016, Published online: 28 Nov 2016

Figures & data

Figure 1. The growth of cells in co-culture system was measured by cell counting chamber and MTT assay. (A) Observation of colorectal cancer cells LoVo, SW480, SW620 cultured alone (left) or co-cultured with CCD-18-co (right) under an optical microscope (40×). (C) Observation of CCD-18-co cultured alone or co-cultured with cancer cells under an optical microscope (200×). (B&D) Cells were harvested and counted by cell counting chamber. **P< 0.01 versus negative.
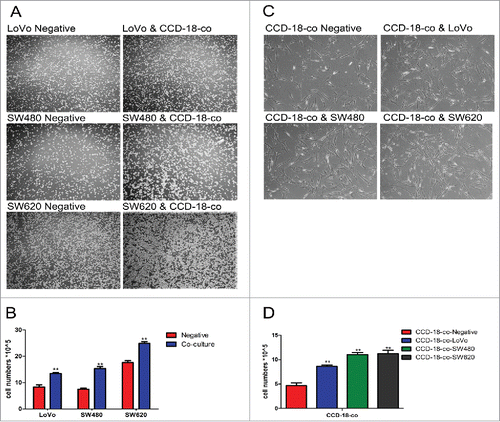
Figure 1. The growth of cells in co-culture system was measured by cell counting chamber and MTT assay. (A) Observation of colorectal cancer cells LoVo, SW480, SW620 cultured alone (left) or co-cultured with CCD-18-co (right) under an optical microscope (40×). (C) Observation of CCD-18-co cultured alone or co-cultured with cancer cells under an optical microscope (200×). (B&D) Cells were harvested and counted by cell counting chamber. **P< 0.01 versus negative.

Table 1. Effects of CCD-18-co-medium on cell viability of colorectal cancer cells (LoVo, SW480, and SW620).

Table 2. Effects of colorectal cancer cells (LoVo, SW480, and SW620) medium on cell viability of CCD-18-co.

Figure 2. Expression changes of metabolism related proteins were measured by Western blot and enzyme activity assay kits. (A) The expression of proteins involved in KREBS cycle and glycolytic pathway in colorectal cancer cells. The two neighboring columns represent expression of indicated proteins in cancer cell lines co-cultured with CCD-18-co compared to their control groups, respectively. β-actin served as control for normalization. *P< 0.05 vs. corresponding negative respectively, **P < 0.01 versus corresponding negative respectively. (B) The expression of proteins involved in KREBS cycle and glycolytic pathway in CCD-18-co cultured with cancer cells or not. β-actin served as control for normalization. *P < 0.05 vs. negative respectively, **P < 0.01 versus negative respectively. (2C&2D) Analysis of PKM2 and IDH2 activities in 3 tumor cell lines. *P < 0.05 vs. negative respectively, **P < 0.01 versus negative respectively. (2E&2F) Analysis of PKM2 and IDH2 in CCD-18-co cultured alone or co-cultured with tumor cells. *P < 0.01 vs. negative respectively.
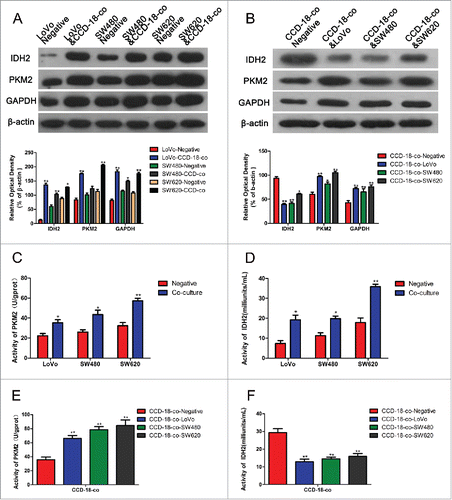
Figure 2. Expression changes of metabolism related proteins were measured by Western blot and enzyme activity assay kits. (A) The expression of proteins involved in KREBS cycle and glycolytic pathway in colorectal cancer cells. The two neighboring columns represent expression of indicated proteins in cancer cell lines co-cultured with CCD-18-co compared to their control groups, respectively. β-actin served as control for normalization. *P< 0.05 vs. corresponding negative respectively, **P < 0.01 versus corresponding negative respectively. (B) The expression of proteins involved in KREBS cycle and glycolytic pathway in CCD-18-co cultured with cancer cells or not. β-actin served as control for normalization. *P < 0.05 vs. negative respectively, **P < 0.01 versus negative respectively. (2C&2D) Analysis of PKM2 and IDH2 activities in 3 tumor cell lines. *P < 0.05 vs. negative respectively, **P < 0.01 versus negative respectively. (2E&2F) Analysis of PKM2 and IDH2 in CCD-18-co cultured alone or co-cultured with tumor cells. *P < 0.01 vs. negative respectively.

Figure 3. Expression of oxidative stress and autophagy related proteins in fibroblasts co-cultured with colorectal cancer cells were measured by western blot and immunofluorescence. (A) Expression of oxidative stress related proteins SOD2 and GSTP1 in CCD-18-co cells co-cultured with tumor cells, β-actin served as loading control. *P < 0.05 versus negative respectively, **P < 0.01 vs. negative respectively. (B) Immunofluorescence observation of SOD2 (red) in CCD-18-co cells co-cultured with tumor cells (63×). (C) Expression of autophagy related proteins LC3, BNIP3 and p62 in CCDs co-cultured with tumor cells. **P < 0.01 versus negative respectively. (D) Immunofluorescence observation of LC3 (green) in CCDs co-cultured with tumor cells (63×).
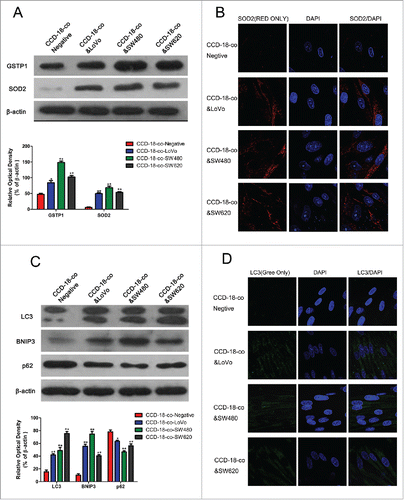
Figure 3. Expression of oxidative stress and autophagy related proteins in fibroblasts co-cultured with colorectal cancer cells were measured by western blot and immunofluorescence. (A) Expression of oxidative stress related proteins SOD2 and GSTP1 in CCD-18-co cells co-cultured with tumor cells, β-actin served as loading control. *P < 0.05 versus negative respectively, **P < 0.01 vs. negative respectively. (B) Immunofluorescence observation of SOD2 (red) in CCD-18-co cells co-cultured with tumor cells (63×). (C) Expression of autophagy related proteins LC3, BNIP3 and p62 in CCDs co-cultured with tumor cells. **P < 0.01 versus negative respectively. (D) Immunofluorescence observation of LC3 (green) in CCDs co-cultured with tumor cells (63×).

Figure 4. Expression changes of metabolic related proteins in CCD-18-co after being treated with inhibitor NAC or 3-MA. (A) Immunofluorescence observation of SOD2 (red) in co-cultured CCD-18-co cells in the presence of oxidative stress inhibitor NAC or autophagy inhibitor 3-MA (63×). (B) Immunofluorescence observation of LC3 (green) in co-cultured CCD-18-co cells in the presence of oxidative stress inhibitors NAC or autophagy inhibitor 3-MA (63×). (C) Expression of metabolism related proteins (IDH2, PKM2, and GAPDH), oxidative stress related proteins (SOD2 and GSTP1) and autophagy related proteins (LC3, BNIP3, and p62) in CCDs co-cultured with colorectal cancer cells under treatment of NAC or 3-MA, respectively. β-actin served as loading control. *P < 0.05 vs. negative respectively, **P < 0.01 versus negative respectively.
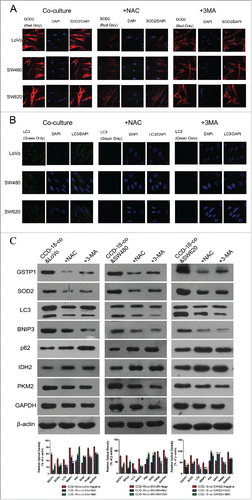
Figure 4. Expression changes of metabolic related proteins in CCD-18-co after being treated with inhibitor NAC or 3-MA. (A) Immunofluorescence observation of SOD2 (red) in co-cultured CCD-18-co cells in the presence of oxidative stress inhibitor NAC or autophagy inhibitor 3-MA (63×). (B) Immunofluorescence observation of LC3 (green) in co-cultured CCD-18-co cells in the presence of oxidative stress inhibitors NAC or autophagy inhibitor 3-MA (63×). (C) Expression of metabolism related proteins (IDH2, PKM2, and GAPDH), oxidative stress related proteins (SOD2 and GSTP1) and autophagy related proteins (LC3, BNIP3, and p62) in CCDs co-cultured with colorectal cancer cells under treatment of NAC or 3-MA, respectively. β-actin served as loading control. *P < 0.05 vs. negative respectively, **P < 0.01 versus negative respectively.

Figure 5. Expression changes of metabolic related proteins in tumor cells after being treated with inhibitor NAC or 3-MA by using western blot and immunofluorescence. (D) Expression of metabolism related proteins IDH2, PKM2, GAPDH in colorectal cancer cells co-cultured with CCD-18-co under treatment of NAC or 3-MA, respectively. *P < 0.05 vs. negative respectively, **P < 0.01 versus negative respectively. (A, B, and C) Immunofluorescence observation of metabolism related proteins GAPDH, PKM2, IDH2 in tumor cells cultured alone or co-cultured with CCD-18-co under treatment of NAC or 3-MA, respectively (63×).
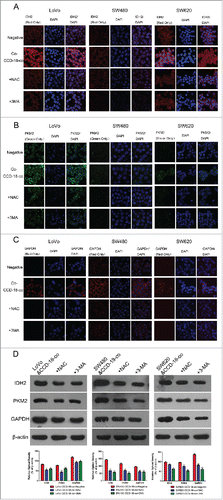
Figure 5. Expression changes of metabolic related proteins in tumor cells after being treated with inhibitor NAC or 3-MA by using western blot and immunofluorescence. (D) Expression of metabolism related proteins IDH2, PKM2, GAPDH in colorectal cancer cells co-cultured with CCD-18-co under treatment of NAC or 3-MA, respectively. *P < 0.05 vs. negative respectively, **P < 0.01 versus negative respectively. (A, B, and C) Immunofluorescence observation of metabolism related proteins GAPDH, PKM2, IDH2 in tumor cells cultured alone or co-cultured with CCD-18-co under treatment of NAC or 3-MA, respectively (63×).
Supplemental material

KCCY_A_1252882_Supplementary_material.zip

Download Zip (372.7 KB)

Reprints and Corporate Permissions

Please note: Selecting permissions does not provide access to the full text of the article, please see our help page How do I view content?

To request a reprint or corporate permissions for this article, please click on the relevant link below:

Academic Permissions

Please note: Selecting permissions does not provide access to the full text of the article, please see our help page How do I view content?

Obtain permissions instantly via Rightslink by clicking on the button below:

If you are unable to obtain permissions via Rightslink, please complete and submit this Permissions form. For more information, please visit our Permissions help page.