2,702
Views
15
CrossRef citations to date
0
Altmetric
Report

NEK8 regulates DNA damage-induced RAD51 foci formation and replication fork protection

, , &
Pages 335-347 | Received 27 Jul 2016, Accepted 04 Nov 2016, Published online: 09 Jan 2017

Figures & data

Figure 1. Kinome siRNA screening identified NEK8 as a protein important for DNA damage-induced RAD51 foci formation. A. Screening strategy for identification of kinases required for RAD51 focus formation. U-2 OS cells were transfected with a siRNA kinome library, treated with MMC, immunostained and imaged for RAD51 focus formation. Representative images of RAD51 focus formation via automated acquisition and quantitation are shown. B. The mean Z-score of each kinase from the RAD51 foci screen are ranked (n = 2). C. Representative image of MMC (60 ng/mL, 24h)-induced RAD51 foci in U-2 OS cells. D. Quantification of the average number of RAD51 foci observed per U-2 OS cell following treatment with MMC (60 ng/mL, 24h). E. U-2 OS cells were transfected with siRNA (20nM). RNA was collected, converted to cDNA and amplified by PCR to confirm depletion. (n = 3, +/- SEM). * = p < 0.05, ** = p < 0.01, *** = p < 0.001 relative to siControl.
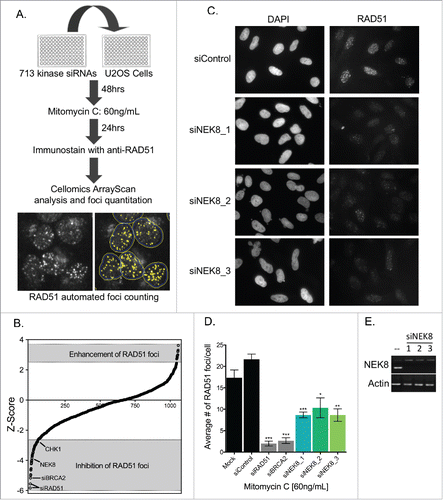
Figure 1. Kinome siRNA screening identified NEK8 as a protein important for DNA damage-induced RAD51 foci formation. A. Screening strategy for identification of kinases required for RAD51 focus formation. U-2 OS cells were transfected with a siRNA kinome library, treated with MMC, immunostained and imaged for RAD51 focus formation. Representative images of RAD51 focus formation via automated acquisition and quantitation are shown. B. The mean Z-score of each kinase from the RAD51 foci screen are ranked (n = 2). C. Representative image of MMC (60 ng/mL, 24h)-induced RAD51 foci in U-2 OS cells. D. Quantification of the average number of RAD51 foci observed per U-2 OS cell following treatment with MMC (60 ng/mL, 24h). E. U-2 OS cells were transfected with siRNA (20nM). RNA was collected, converted to cDNA and amplified by PCR to confirm depletion. (n = 3, +/- SEM). * = p < 0.05, ** = p < 0.01, *** = p < 0.001 relative to siControl.

Figure 2. NEK8 modulates RAD51 foci formation following DNA damage and replication fork stall. A. Representative image of IR (10Gy, 6h)-induced RAD51 foci in U-2 OS cells treated with indicated siRNA. B. Quantification of the percentage of siRNA depleted U-2 OS cells with greater than 5 RAD51 foci following treatment with IR (10Gy, 6h), MMC (60 ng/mL, 24h) and HU (2 mM, 24 h). C. Western blot of key DNA repair protein expression in U-2 OS cells depleted of NEK8. D. siRNAs targeting NEK8 were transfected into U-2 OS cells (20nM), treated with HU (2 mM, 24 h) or untreated, then fixed and stained with propidium iodide prior to FACS cell cycle analysis. E. Representative image of IR (10Gy, 6 h) induced RAD51 foci in Nek8+/+ and Nek8−/− MEFs. F. Quantification of the percentage of Nek8+/+ and Nek8−/− MEFs with greater than 5 RAD51 foci following treatment with IR (10Gy, 6 h), MMC (60 ng/mL, 24 h) and HU (2 mM, 6 h). G. Western blot of key DNA repair protein expression in Nek8+/+ and Nek8−/− MEFs. H. Nek8+/+ and Nek8−/− MEFs were treated with HU (2 mM, 24 h) or untreated, harvested, fixed and stained with propidium iodide prior to FACS cell cycle analysis. (n = 3, +/- SEM). * = p < 0.05, ** = p < 0.01, *** = p < 0.001 relative to siControl or Nek8+/+ MEFs.
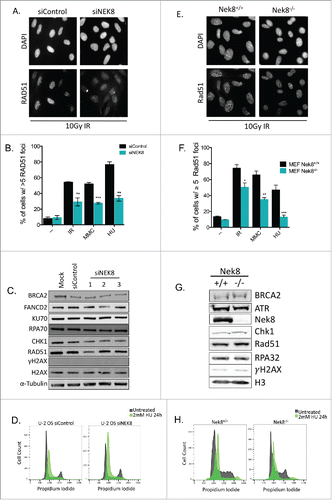
Figure 2. NEK8 modulates RAD51 foci formation following DNA damage and replication fork stall. A. Representative image of IR (10Gy, 6h)-induced RAD51 foci in U-2 OS cells treated with indicated siRNA. B. Quantification of the percentage of siRNA depleted U-2 OS cells with greater than 5 RAD51 foci following treatment with IR (10Gy, 6h), MMC (60 ng/mL, 24h) and HU (2 mM, 24 h). C. Western blot of key DNA repair protein expression in U-2 OS cells depleted of NEK8. D. siRNAs targeting NEK8 were transfected into U-2 OS cells (20nM), treated with HU (2 mM, 24 h) or untreated, then fixed and stained with propidium iodide prior to FACS cell cycle analysis. E. Representative image of IR (10Gy, 6 h) induced RAD51 foci in Nek8+/+ and Nek8−/− MEFs. F. Quantification of the percentage of Nek8+/+ and Nek8−/− MEFs with greater than 5 RAD51 foci following treatment with IR (10Gy, 6 h), MMC (60 ng/mL, 24 h) and HU (2 mM, 6 h). G. Western blot of key DNA repair protein expression in Nek8+/+ and Nek8−/− MEFs. H. Nek8+/+ and Nek8−/− MEFs were treated with HU (2 mM, 24 h) or untreated, harvested, fixed and stained with propidium iodide prior to FACS cell cycle analysis. (n = 3, +/- SEM). * = p < 0.05, ** = p < 0.01, *** = p < 0.001 relative to siControl or Nek8+/+ MEFs.

Figure 3. NEK8 is required for resistance to replication stress and acts independently of ATR. A. Cell survival in Nek8+/+ and Nek8−/− MEFs in response to increasing doses of hydroxyurea, MMC, PARP inhibitor (AZD2281), ATR inhibitor (VE-821), etoposide or paclitaxel as indicated. Cell survival was assayed by crystal violet staining and expressed as a fraction of the untreated control (n = 3, +/- SEM). B. U-2 OS cells were transfected with siRNA (20nM) and treated with or without HU (2 mM 24 h). Cells were then subjected to chromatin fractionation (S, soluble fraction; P, insoluble fraction (chromatin fraction)) and Western blotting. C. Nek8+/+ and Nek8−/− MEFs were treated with or without HU (2 mM 6 h) and then subjected to chromatin fractionation (S, soluble fraction; P, insoluble fraction (chromatin fraction)) and Western blotting. D. Cell survival in Nek8+/+ and Nek8−/− MEFs in response to a 6 h pulse of HU, with or without ATR inhibition followed by release into fresh media. Cell survival was assayed by crystal violet staining and expressed as a fraction of the untreated control (n = 7, +/-SEM).
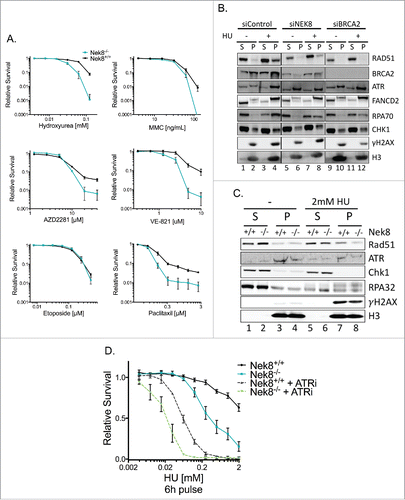
Figure 3. NEK8 is required for resistance to replication stress and acts independently of ATR. A. Cell survival in Nek8+/+ and Nek8−/− MEFs in response to increasing doses of hydroxyurea, MMC, PARP inhibitor (AZD2281), ATR inhibitor (VE-821), etoposide or paclitaxel as indicated. Cell survival was assayed by crystal violet staining and expressed as a fraction of the untreated control (n = 3, +/- SEM). B. U-2 OS cells were transfected with siRNA (20nM) and treated with or without HU (2 mM 24 h). Cells were then subjected to chromatin fractionation (S, soluble fraction; P, insoluble fraction (chromatin fraction)) and Western blotting. C. Nek8+/+ and Nek8−/− MEFs were treated with or without HU (2 mM 6 h) and then subjected to chromatin fractionation (S, soluble fraction; P, insoluble fraction (chromatin fraction)) and Western blotting. D. Cell survival in Nek8+/+ and Nek8−/− MEFs in response to a 6 h pulse of HU, with or without ATR inhibition followed by release into fresh media. Cell survival was assayed by crystal violet staining and expressed as a fraction of the untreated control (n = 7, +/-SEM).

Figure 4. Nek8 prevents replication fork degradation following replication fork stall. A. Schematic of experimental conditions for DNA replication tract assay. Red tracts, IdU; Green tracts, CldU. B. IdU tract length in HU treated or untreated Nek8+/+ and Nek8−/− MEFs. Median tract length is designated in box and whisker plots. C. CldU tract length in HU treated or untreated Nek8+/+ and Nek8−/− MEFs. Mean tract length is denoted in parenthesis and median tract length is designated in box and whisker plots. D. Schematic of experimental conditions for DNA replication tract assay treated with Mirin. Green tracts, CldU. E. CldU tract length in HU treated (4mM, 5 h) and Mirin treated or untreated Nek8+/+ and Nek8−/− MEFs. Mean tract length is denoted in parenthesis and median tract length is designated in box and whisker plots F. Representative DNA fiber images from Nek8+/+ and Nek8−/− MEFs either treated or untreated with HU. (n=∼300 fibers/sample) *** = p < .001, * = p < .05.
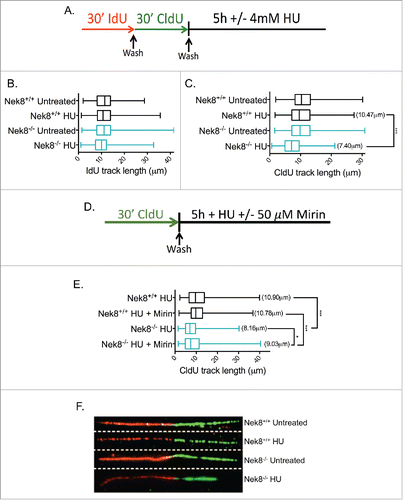
Figure 4. Nek8 prevents replication fork degradation following replication fork stall. A. Schematic of experimental conditions for DNA replication tract assay. Red tracts, IdU; Green tracts, CldU. B. IdU tract length in HU treated or untreated Nek8+/+ and Nek8−/− MEFs. Median tract length is designated in box and whisker plots. C. CldU tract length in HU treated or untreated Nek8+/+ and Nek8−/− MEFs. Mean tract length is denoted in parenthesis and median tract length is designated in box and whisker plots. D. Schematic of experimental conditions for DNA replication tract assay treated with Mirin. Green tracts, CldU. E. CldU tract length in HU treated (4mM, 5 h) and Mirin treated or untreated Nek8+/+ and Nek8−/− MEFs. Mean tract length is denoted in parenthesis and median tract length is designated in box and whisker plots F. Representative DNA fiber images from Nek8+/+ and Nek8−/− MEFs either treated or untreated with HU. (n=∼300 fibers/sample) *** = p < .001, * = p < .05.

Figure 5. Nek8 is important for homologous recombination efficiency and the maintenance of genome stability. A. U-2 OS DR-GFP cells were transfected with siRNA (20nM). 24 h post transfection cells were transfected with pCBASce or control plasmids. GFP expression was detected and quantified via flow cytometry. Representative GFP+ population is denoted as a percentage. B. Quantification of U-2 OS DR-GFP assay using relative GFP expression (n = 3, +/- SEM, *p<.05, **p<.01). C. Representative images of metaphase chromosomes of Nek8+/+ and Nek8−/− MEFs treated with or without HU for 6 h and then released into fresh media for 16 h. The cells were then treated with colcemid and processed for metaphase analysis. D. Quantification of mean chromosome aberrations per metaphase (aberrations include: breaks, gaps, radials and other translocations) (n = 30 metaphases per sample, +/- SEM).
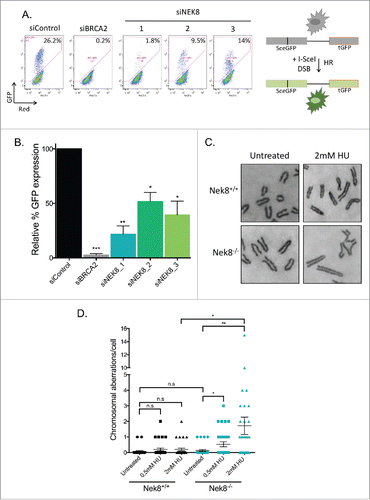
Figure 5. Nek8 is important for homologous recombination efficiency and the maintenance of genome stability. A. U-2 OS DR-GFP cells were transfected with siRNA (20nM). 24 h post transfection cells were transfected with pCBASce or control plasmids. GFP expression was detected and quantified via flow cytometry. Representative GFP+ population is denoted as a percentage. B. Quantification of U-2 OS DR-GFP assay using relative GFP expression (n = 3, +/- SEM, *p<.05, **p<.01). C. Representative images of metaphase chromosomes of Nek8+/+ and Nek8−/− MEFs treated with or without HU for 6 h and then released into fresh media for 16 h. The cells were then treated with colcemid and processed for metaphase analysis. D. Quantification of mean chromosome aberrations per metaphase (aberrations include: breaks, gaps, radials and other translocations) (n = 30 metaphases per sample, +/- SEM).
Supplemental material

KCCY_A_1259038_Supplementary_material.zip

Download Zip (5.6 MB)