1,333
Views
26
CrossRef citations to date
0
Altmetric
Report

miRNA-34c inhibits myoblasts proliferation by targeting YY1

, , , , , , , , , , & show all
Pages 1661-1672 | Received 19 Oct 2016, Accepted 05 Jan 2017, Published online: 24 Aug 2017

Figures & data

Figure 1. miR-34c exhibited low expression in proliferating myoblasts and were upregulated during skeletal muscle regeneration. (A) miR-34 expression was determined by qPCR from C2C12 myoblasts cultured in growth medium and differentiation medium for 1–5 d. (B) Immunoblotting was performed to detect MyHC protein expression as an indication of the differentiation status at the indicated times. (C) miR-34c was upregulated on days 1–21 post-CTX injury based on q-PCR analysis. miR-34c expression in skeletal muscle before CTX injection was set to 1.0. The results are expressed as the mean ± SD of 3 replicates.
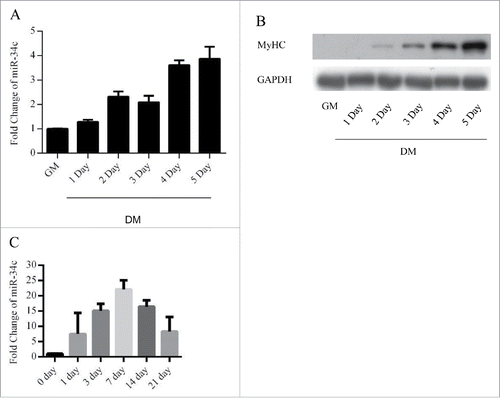
Figure 1. miR-34c exhibited low expression in proliferating myoblasts and were upregulated during skeletal muscle regeneration. (A) miR-34 expression was determined by qPCR from C2C12 myoblasts cultured in growth medium and differentiation medium for 1–5 d. (B) Immunoblotting was performed to detect MyHC protein expression as an indication of the differentiation status at the indicated times. (C) miR-34c was upregulated on days 1–21 post-CTX injury based on q-PCR analysis. miR-34c expression in skeletal muscle before CTX injection was set to 1.0. The results are expressed as the mean ± SD of 3 replicates.

Figure 2. miR-34c inhibited C2C12 myoblasts proliferation. (A) After transfection 24 h, miR-34c expression was determined by qPCR in C2C12 myoblasts transfected with miR-34c mimics or negative control (NC) mimics. (B) C2C12 myoblasts were collected for cell cycle analysis. Flow cytometry was used to identify the percentage of cells in G0/G1, S, and G2 phases. (C) C2C12 cells were stained with EdU. The scale bar represents 200 μm. The percentage of EdU+ C2C12 cells was quantified (right). (D) The mRNA expression of cell cycle genes was detected by qPCR. (E) The protein expression of cell cycle genes was detected by western blotting. (F) After transfection 36 h, miR-34c expression was determined by qPCR in C2C12 myoblasts transfected with miR-34c inhibitor or NC inhibitor. (G) C2C12 myoblasts were collected for cell cycle analysis. Flow cytometry was used to determine the percentage of cells in G0/G1, S, and G2 phases. (H) C2C12 cells were stained with EdU. The scale bar represents 200 μm. The percentage of EdU+ C2C12 cells was quantified (right). (I) The mRNA expression of cell cycle genes was detected by qPCR. (J) The protein expression of cell cycle genes was detected by western blotting. All of the results are expressed as the mean ± SD *P < 0.05; **P < 0.01.
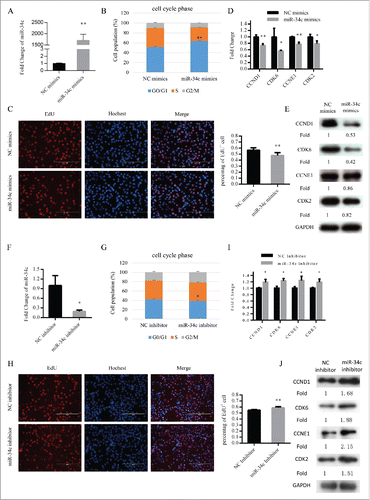
Figure 2. miR-34c inhibited C2C12 myoblasts proliferation. (A) After transfection 24 h, miR-34c expression was determined by qPCR in C2C12 myoblasts transfected with miR-34c mimics or negative control (NC) mimics. (B) C2C12 myoblasts were collected for cell cycle analysis. Flow cytometry was used to identify the percentage of cells in G0/G1, S, and G2 phases. (C) C2C12 cells were stained with EdU. The scale bar represents 200 μm. The percentage of EdU+ C2C12 cells was quantified (right). (D) The mRNA expression of cell cycle genes was detected by qPCR. (E) The protein expression of cell cycle genes was detected by western blotting. (F) After transfection 36 h, miR-34c expression was determined by qPCR in C2C12 myoblasts transfected with miR-34c inhibitor or NC inhibitor. (G) C2C12 myoblasts were collected for cell cycle analysis. Flow cytometry was used to determine the percentage of cells in G0/G1, S, and G2 phases. (H) C2C12 cells were stained with EdU. The scale bar represents 200 μm. The percentage of EdU+ C2C12 cells was quantified (right). (I) The mRNA expression of cell cycle genes was detected by qPCR. (J) The protein expression of cell cycle genes was detected by western blotting. All of the results are expressed as the mean ± SD *P < 0.05; **P < 0.01.
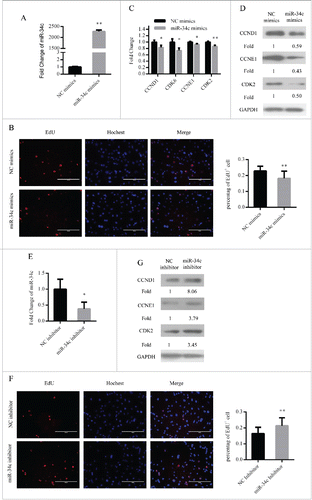
Figure 3. miR-34c inhibited primary myoblasts proliferation. (A) After transfection 24 h, miR-34c expression was determined by qPCR in primary myoblasts transfected with miR-34c mimics or negative control (NC) mimics. (B) Primary myoblasts cells were stained with EdU. The scale bar represents 200 μm. The percentage of EdU+ primary myoblasts cells was quantified (right). (C) The mRNA expression of cell cycle genes was detected by qPCR. (D) The protein expression of cell cycle genes was detected by western blotting. (E) After transfection 36 h, miR-34c expression was determined by qPCR in primary myoblasts transfected with miR-34c inhibitor or NC inhibitor. (F) Primary myoblasts cells were stained with EdU. The scale bar represents 200 μm. The percentage of EdU+ C2C12 cells was quantified (right). (G) The protein expression of cell cycle genes was detected by western blotting. All of the results are expressed as the mean ± SD *P < 0.05; **P < 0.01.

Figure 3. miR-34c inhibited primary myoblasts proliferation. (A) After transfection 24 h, miR-34c expression was determined by qPCR in primary myoblasts transfected with miR-34c mimics or negative control (NC) mimics. (B) Primary myoblasts cells were stained with EdU. The scale bar represents 200 μm. The percentage of EdU+ primary myoblasts cells was quantified (right). (C) The mRNA expression of cell cycle genes was detected by qPCR. (D) The protein expression of cell cycle genes was detected by western blotting. (E) After transfection 36 h, miR-34c expression was determined by qPCR in primary myoblasts transfected with miR-34c inhibitor or NC inhibitor. (F) Primary myoblasts cells were stained with EdU. The scale bar represents 200 μm. The percentage of EdU+ C2C12 cells was quantified (right). (G) The protein expression of cell cycle genes was detected by western blotting. All of the results are expressed as the mean ± SD *P < 0.05; **P < 0.01.

Figure 4. miR-34c promoted C2C12 myoblasts differentiation. (A–E) Cells were transfected with miR-34c mimics in growth medium and samples were collected at DM1 and DM3. (A) The mRNA expression of miR-34c was detected by qPCR. (B) The mRNA expression of MyoG was detected by qPCR at DM1. (C) The protein expression of MyoG was detected by western blotting at DM1. (D) Cells were fixed and immunostained for MyHC at DM3, and nuclei were stained blue with DAPI (left); the scale bar represents 400 μm, and the analysis of the number of fused myotubes per field is shown (right). (E) The protein expression of MyHC was detected by western blotting at DM3. (F–J) Cells were transfected with miR-34c mimics in GM and samples were collected at DM1 and DM3. (F) The mRNA expression of miR-34c was detected by qPCR. (G) The mRNA expression of MyoG was detected by qPCR at DM1. (H) The protein expression of MyoG was detected by western blotting at DM1. (I) Cells were fixed and immunostained for MyHC at DM3, and nuclei were stained blue with DAPI (left); the scale bar represents 400 μm. The analysis of the number of fused myotubes per field is shown (right). (J) The protein expression of MyHC was detected by western blotting at DM3. All results are expressed as the mean ± SD *P < 0.05; **P < 0.01.
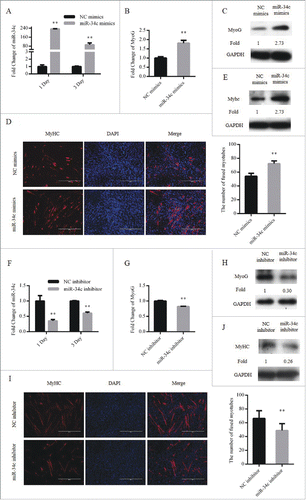
Figure 4. miR-34c promoted C2C12 myoblasts differentiation. (A–E) Cells were transfected with miR-34c mimics in growth medium and samples were collected at DM1 and DM3. (A) The mRNA expression of miR-34c was detected by qPCR. (B) The mRNA expression of MyoG was detected by qPCR at DM1. (C) The protein expression of MyoG was detected by western blotting at DM1. (D) Cells were fixed and immunostained for MyHC at DM3, and nuclei were stained blue with DAPI (left); the scale bar represents 400 μm, and the analysis of the number of fused myotubes per field is shown (right). (E) The protein expression of MyHC was detected by western blotting at DM3. (F–J) Cells were transfected with miR-34c mimics in GM and samples were collected at DM1 and DM3. (F) The mRNA expression of miR-34c was detected by qPCR. (G) The mRNA expression of MyoG was detected by qPCR at DM1. (H) The protein expression of MyoG was detected by western blotting at DM1. (I) Cells were fixed and immunostained for MyHC at DM3, and nuclei were stained blue with DAPI (left); the scale bar represents 400 μm. The analysis of the number of fused myotubes per field is shown (right). (J) The protein expression of MyHC was detected by western blotting at DM3. All results are expressed as the mean ± SD *P < 0.05; **P < 0.01.

Figure 5. YY1 is a direct target of miR-34c. (A) The protein (left) and mRNA (right) expression of YY1 in proliferating and differentiated C2C12 myoblasts. (B) 293T cells were transfected with YY1 3′-UTR wild-type or mutant luciferase reporters and co-transfected with miR-34c mimics or negative control (NC) mimics. The relative luciferase activity was evaluated 24 h later. After C2C12 cells were transfected with miR-34c or NC mimics, (C) the levels of YY1 mRNA were assessed by qPCR, (D) and the levels of the YY1 protein were determined by western blotting. After C2C12 cells were transfected with miR-34C or NC inhibitor, (E) the levels of YY1 mRNA were assessed by qPCR, (F) and the levels of YY1 protein were visualized by western blotting. (G) After primary myoblasts cells were transfected with miR-34c or NC mimics, the levels of the YY1 mRNA were determined by qPCR (left) and the levels of the YY1 proteins were visualized by western blotting (right). (H) After primary myoblasts cells were transfected with miR-34c or NC inhibitor, the levels of the YY1 proteins were visualized by western blotting. All of the results are expressed as the mean ± SD *P < 0.05; **P < 0.01.
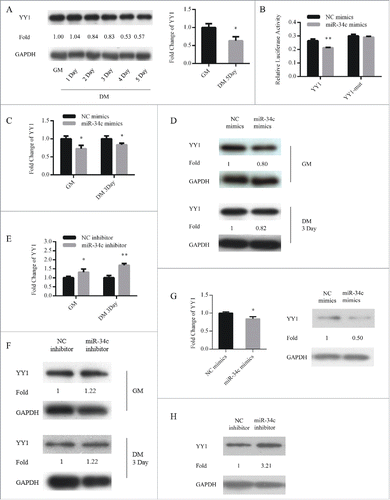
Figure 5. YY1 is a direct target of miR-34c. (A) The protein (left) and mRNA (right) expression of YY1 in proliferating and differentiated C2C12 myoblasts. (B) 293T cells were transfected with YY1 3′-UTR wild-type or mutant luciferase reporters and co-transfected with miR-34c mimics or negative control (NC) mimics. The relative luciferase activity was evaluated 24 h later. After C2C12 cells were transfected with miR-34c or NC mimics, (C) the levels of YY1 mRNA were assessed by qPCR, (D) and the levels of the YY1 protein were determined by western blotting. After C2C12 cells were transfected with miR-34C or NC inhibitor, (E) the levels of YY1 mRNA were assessed by qPCR, (F) and the levels of YY1 protein were visualized by western blotting. (G) After primary myoblasts cells were transfected with miR-34c or NC mimics, the levels of the YY1 mRNA were determined by qPCR (left) and the levels of the YY1 proteins were visualized by western blotting (right). (H) After primary myoblasts cells were transfected with miR-34c or NC inhibitor, the levels of the YY1 proteins were visualized by western blotting. All of the results are expressed as the mean ± SD *P < 0.05; **P < 0.01.

Figure 6. miR-34c regulates myoblasts proliferation through YY1. (A–E) C2C12 cells were transfected with si-YY1 or si-NC (negative control) in growth medium (GM) and collected 24 h after transfection. (A) miR-34c mRNA expression was determined by qPCR (left) and protein expression was determined by western blotting (right). (B) Flow cytometry was used to determine the percentage of cells in G0/G1, S, and G2 phases. (C) C2C12 cells were stained with EdU. The scale bar represents 200 μm. The percentage of EdU+ C2C12 cells was quantified (right). (D) The mRNA expression of cell cycle genes was detected by qPCR. (E) The protein expression of cell cycle genes was determined by western blotting. (F) C2C12 cells were transfected with a YY1-expressing plasmid (pCMV-YY1) or a control vector and co-transfected with miR-34c mimics or NC mimics for 24 h. Flow cytometry was used to determine the percentage of cells in G0/G1, S, and G2 phases. (G–J) Cells were transfected with si-YY1 or si-NC in GM and collected at DM1 and DM3. (G) The mRNA expression of YY1 was detected by qPCR (left) and the protein expression of YY1 was detected by western blotting at the indicated times (right). (H) The mRNA expression of MyoG was detected by qPCR at DM1 (left). The protein expression of MyoG was assessed by western blotting at DM1 (right). (I) Cells were fixed and immunostained for MyHC at DM3, and nuclei were stained blue with DAPI (left), the scale bar represents 400 μm, and the number of fused myotubes per field was analyzed (right). (J) The protein expression of MyHC was determined by western blotting at DM3. All results are expressed as the mean ± SD *P < 0.05; **P < 0.01.
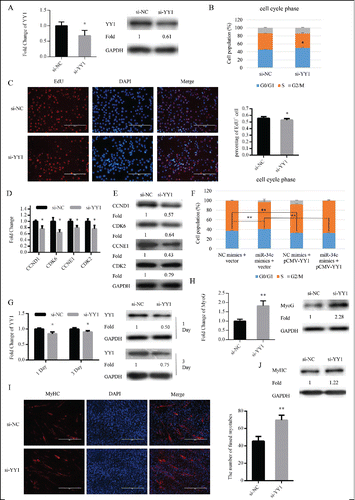
Figure 6. miR-34c regulates myoblasts proliferation through YY1. (A–E) C2C12 cells were transfected with si-YY1 or si-NC (negative control) in growth medium (GM) and collected 24 h after transfection. (A) miR-34c mRNA expression was determined by qPCR (left) and protein expression was determined by western blotting (right). (B) Flow cytometry was used to determine the percentage of cells in G0/G1, S, and G2 phases. (C) C2C12 cells were stained with EdU. The scale bar represents 200 μm. The percentage of EdU+ C2C12 cells was quantified (right). (D) The mRNA expression of cell cycle genes was detected by qPCR. (E) The protein expression of cell cycle genes was determined by western blotting. (F) C2C12 cells were transfected with a YY1-expressing plasmid (pCMV-YY1) or a control vector and co-transfected with miR-34c mimics or NC mimics for 24 h. Flow cytometry was used to determine the percentage of cells in G0/G1, S, and G2 phases. (G–J) Cells were transfected with si-YY1 or si-NC in GM and collected at DM1 and DM3. (G) The mRNA expression of YY1 was detected by qPCR (left) and the protein expression of YY1 was detected by western blotting at the indicated times (right). (H) The mRNA expression of MyoG was detected by qPCR at DM1 (left). The protein expression of MyoG was assessed by western blotting at DM1 (right). (I) Cells were fixed and immunostained for MyHC at DM3, and nuclei were stained blue with DAPI (left), the scale bar represents 400 μm, and the number of fused myotubes per field was analyzed (right). (J) The protein expression of MyHC was determined by western blotting at DM3. All results are expressed as the mean ± SD *P < 0.05; **P < 0.01.

Reprints and Corporate Permissions

Please note: Selecting permissions does not provide access to the full text of the article, please see our help page How do I view content?

To request a reprint or corporate permissions for this article, please click on the relevant link below:

Academic Permissions

Please note: Selecting permissions does not provide access to the full text of the article, please see our help page How do I view content?

Obtain permissions instantly via Rightslink by clicking on the button below:

If you are unable to obtain permissions via Rightslink, please complete and submit this Permissions form. For more information, please visit our Permissions help page.