Figures & data
Table 1. A summary table of existing Fcar variants including our novel variant APD. Accessions, references and exon segment features are listed for comparison. Corresponding amino acids of the sequence segments are numbered based on the full-length variant 1. Each variant had the signal peptide analyzed using SignalP with scores: max C, mean S, D score and possible cleavage site calculations shown. The extracellular detection of the variants are expressed in percentage derived from FACS data as shown in .
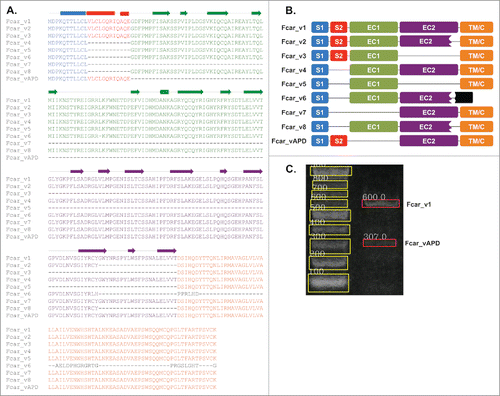
Figure 1. Fcar variants and variant APD. (A) Multiple sequence alignment of the current 8 variants with variant APD. The drawing above the alignment shows the secondary structure presentation of the wild type Fcar_v1. The blocks represent helices; arrows for β strands; and lines for coils. (B) A schematic presentation of the 9 variants showing the domains: signal peptide domains (S1 in blue and S2 in red), extracellular domains (EC1 in green, EC2 in purple), transmembrane (TM/C in orange), and the secreted region (in black) present only in Fcar_v6. Among the 4 variants 1, 4, 7 and APD, both 4 and 7 lack the S2 domain, whereas variants 7 and APD lack the EC1 domain. (C) Agarose gel image of the PCR product from the cDNA template obtained from a healthy volunteer's PBMC using Fcar_vAPD specific primers that bind to S2 and EC2 domains. The band sizes of 580bp (600 bp in the gel) and 289bp (307 bp in the gel) were calculated using GelApp.Citation30

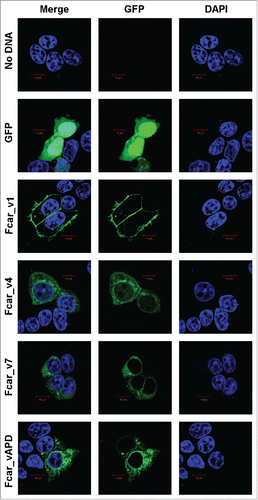
Figure 2. Confocal microscopy analysis of the Fcar cellular localization with GFP-tagged proteins and DAPI. EXPI cells were transfected with plasmids containing Fcar variants 1, 4, 7, and APD with c-terminal eGFP. Controls: plasmid (e-GFP only) and no plasmid. Cells were fixed and mounted onto glass slides and viewed using Zeiss confocal microscopy Meta upright LSM5100. Positive control eGFP proteins as well as Fcar variants 4, 7, and APD were found to be intracellular localized. Only Fcar_v1 (Fcar_v1-GFP) was found to be predominantly lining the plasma membrane. The figure shown is representative of at least 4 independent experiments.

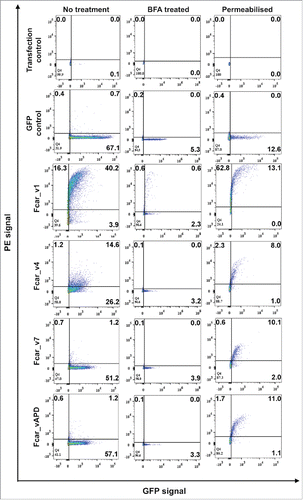
Figure 3. FACS analysis of the Fcar variants with GFP tags. EXPI 293 cells transfected with the various Fcar-eGFP variants were stained with mouse polyclonal anti-CD89 antibody followed by anti-mouse IgG1-PE. Values on the dot plots represent percentages of cells in each quadrant. The left column shows the experiment set for “no treatment” to detect protein expression on the cell surface. The center column shows BFA treated cells. The right column shows permeabilised cell staining to detect intracellularly proteins. Gating was performed based on the no plasmid and eGFP controls. eGFP control cells were transfected with e-GFP construct and stained with polyclonal anti-CD89 followed by anti-mouse IgG conjugate with PE. All variants with the exception of the wild-type variant 1-GFP (40.2%) were found to be in minute amounts on the cell surface as detected by the PE signals. Dampening of all Fcar variants-GFP expression were observed with BFA treatment. When untreated, Fcar_v4 transfected cells showed 14.6% extracellular presence. This effect was also diminished with BFA treatment. All variants with the GFP tags were detected by polyclonal anti-CD89 when cells were permeabilised. Each FACS experiment is based on 20,000 events and of at least 4 independent experiments.

Table 2. Comparison of Fcar variants and the signal peptide and cleavage site mutants used in this study. Table shows the protein residue number, and various mutations made to the respective exon segments. The variants and mutants were analyzed using the SignalP tool for calculations on the signal peptide (max C, mean S, D score) and possible cleavage sites. Extracellular detection percentages were determined from FACS experiments as show in where variant 1 and variant APD were repeatedly tested.
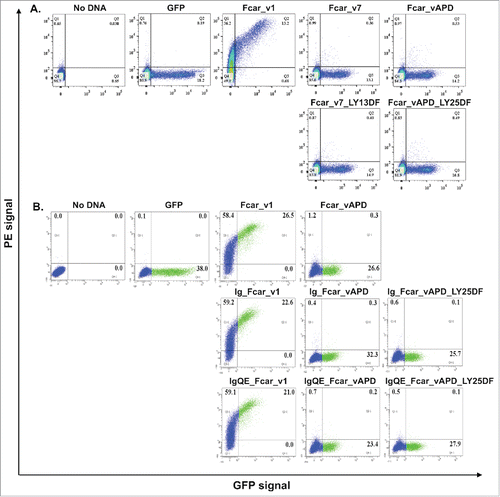
Figure 4. Analysis of signal peptide and cleavage site mutations. EXPI 293 cells transfected with the various mutants modifications made to the Fcar-eGFP variants and stained with mouse polyclonal anti-CD89 antibody followed by anti-mouse IgG1-PE for FACS analysis. Values on the dot plots represent percentages of cells in each quadrant. Gating was performed based on the no plasmid and eGFP controls. eGFP control cells were transfected with e-GFP construct and stained with polyclonal anti-CD89 followed by anti-mouse IgG conjugate with PE. (A) Analysis of variant 7 and APD mutants with the first 2 amino acids in EC2 (LY) substituted with that of EC1 (DF). With and without the S2 domain, modifications to the start of EC2 did not result in increased cell surface presence of the variants. (B) Analysis of signal peptide and cleavage site mutations. Fcar mutants with the IgE signal peptide with and without the additional S2-EC1 cleavage site QE were used to displace the original S1+S2 signal peptide on variants 1 and APD as well as mutant variant APD with EC1 (DF) substitution mutations on EC2. Regardless of the signal peptide and the presence of the QE cleavage site and the substitution on EC2, variant APD was not detected to have increased extracellular presence as determined by FACS. Each FACS experiment is based on 20,000 events and repeated at least 3 independent times.

