Figures & data
Figure 1. A workflow of this study.
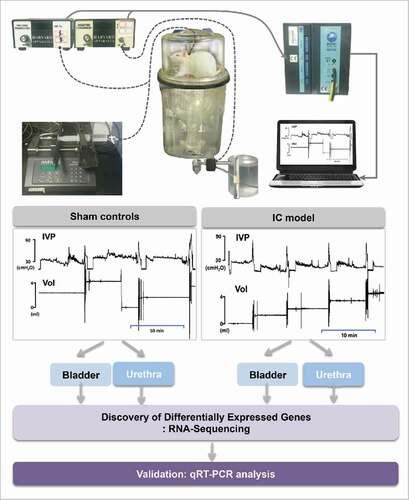
Table 1. Cystometric parameters in conscious, unrestrained Sprague-Dawley rats in the sham and IC groups. . Cystometric parameters (including pressure and volume parameters) in awake rats subjected to sham-operation or intravesical PS/LPS-treated rats (IC rats).
Figure 2. Identification of differentially expressed genes (DEGs) in bladder or urethra obtained from IC rats compared with sham controls. (A) A heatmap showing DEGs (B) Diagrams indicating IC-specific DEGs in bladder or urethra (upper), and bladder- or urethra-specific DEGs associated with IC (bottom).
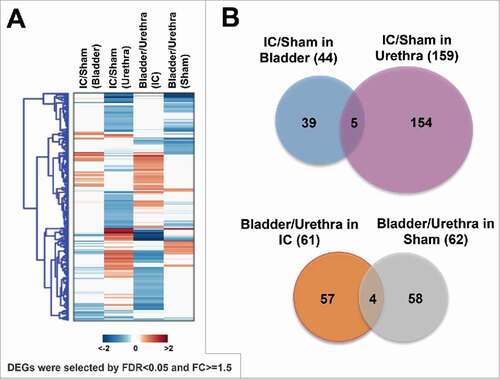
Table 2. (A) List of 5 common genes in the comparison of IC vs. Sham controls, (B) List of 4 common genes in the comparison of bladder vs. urethra.
Figure 3. (A) Enriched cellular processes perturbed in IC rats by PS and LPS treatment. Representative DEGs of “response to abiotic stimulus” and “epithelial cell differentiation” were indicated in orange boxes. Blue, bladder specific; Orange, urethra-specific DEGs. (B) Differentially enriched cellular processes changed sham or IC specifically. Gray, sham control specific; Green, IC specific DEGs.
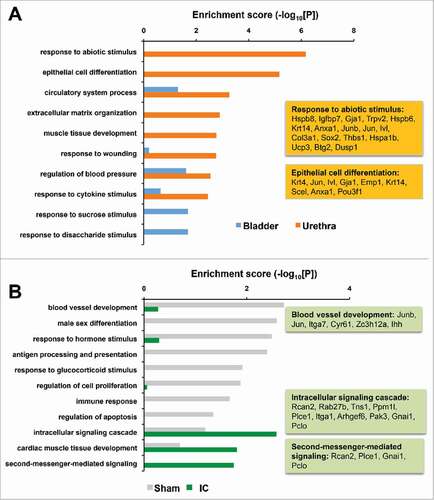
Figure 4. (A) Bladder specific DEGs, (B) Urethra specific DEGs, (C) Expression patterns obtained from RNA-Sequencing data of 10 genes.
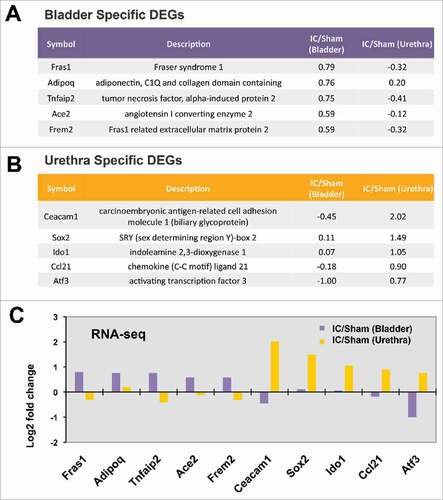
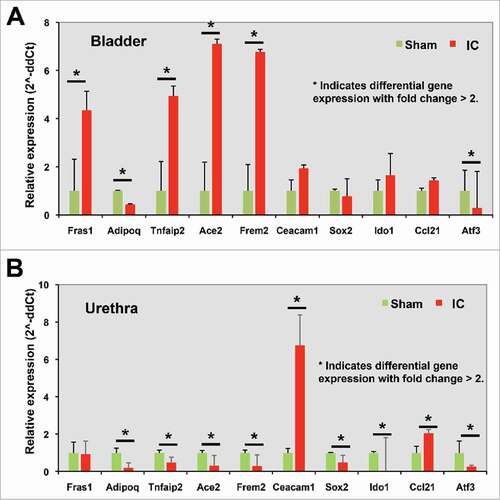
Figure 5. Further validation using qRT-PCR analysis.