Figures & data
Figure 1. p16 expression is increased in MECs during age-induced senescence. (A) mRNA expression of mammary tissue was analyzed by q-RT-PCR in WT young (2–4-month-old) and old (12–24-month-old) virgin mice. Data are expressed as the mean ± SD from triplicates of each 2 separate mice. (B-E) Representative immunohistochemical staining of p16 (B), Ki67 (C) and γH2AX (E) in 3 mice per group, and SA-β-gal assay in 2 animals per group (D), in mammary glands. The percentages of Ki67-positive cells in (C) were calculated from cells situated in clear duct/gland structure, and the results represent the mean ± SD of 3 animals per group. Note the significant decrease of Ki67-positive cells and strong p16 and SA-β-gal staining in MECs from old mammary glands.
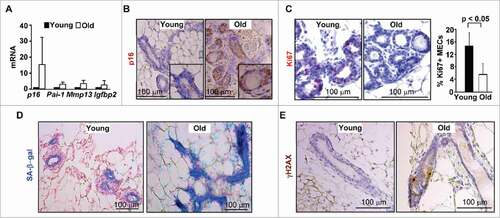
Figure 2. Loss of p16 rescues the age-induced senescence of MECs, and increases mammary stem cell function. (A) mRNA expression was analyzed by q-RT-PCR from WT virgin mammary tissue of old mice. q-RT-PCR data are expressed as the mean ± SD from duplicates of each of 3 separate mice in each age group. (B, C) Representative immunohistochemical staining of Ki67 in age-matched mammary glands. Results for the quantification of Ki67-positive MECs. Results represent the mean ± SD of 3 animals per group. (D, E) Mammary cells freshly isolated from both WT and p16−/− old mice were analyzed by colony formation and mammosphere assays. The number of colonies and spheres larger than 20µm was quantified. The bar graphs represent the mean ± SD from duplicates of each 3 separate mice. (F) Mammary cells isolated from old mice of the indicated genotypes were transplanted into the cleared MFPs of 3-week-old NSG mice. The mammary glands were dissected after 8 weeks and analyzed for the percentage of mammary fat pad filled. The bar graph represents the mean ± SD of N = 8 for WT and N = 4 for p16−/− mice examined for each group respectively.
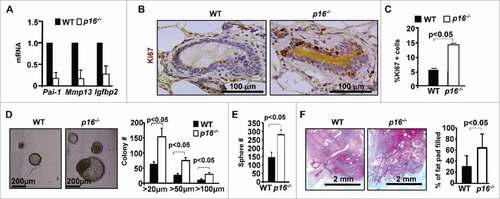
Figure 3. Brca1 depletion in the mammary epithelium leads to senescence, and a functional decline of mammary stem cells. (A) Representative immunohistochemical staining of p16 in mammary glands of WT and Brca1f/−;MC mice in 3 mice per group. (B) mRNA expression of mammary tissue was analyzed by q-RT-PCR in WT and Brca1f/−;MC mice. Data represent the mean ± SD from duplicates of 2 mice per genotype. (C, D) Mammary cells from age-matched WT and Brca1f/−;MC mice were isolated and analyzed by colony formation and mammosphere assays. Colonies and spheres larger than 20 µm were quantified. Bar graph, mean ± SD from duplicates of each 2 separate mice per genotype. (E) Representative mammary outgrowths from transplanted MECs of age-matched WT and Brca1f/−;MC mice. The mammary glands were dissected after 8 weeks and analyzed for the percentage of mammary fat pad filled. The bar graph represents the mean ± SD of N = 8 for WT and N = 5 for WT and Brca1f/−;MC mice respectively.
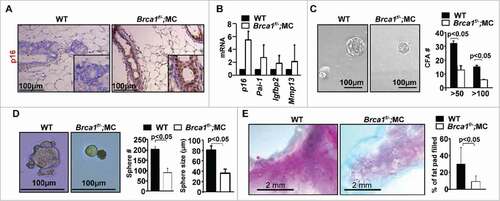
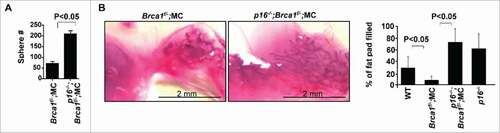
Figure 4. Loss of p16 rescues the decline in mammary stem cell function caused by Brca1 deficiency. (A) Mammary cells freshly isolated from WT, Brca1f/−;MC, p16−/−;Brca1f/−;MC and p16−/− mice were analyzed by mammosphere assay. After 2 weeks the number of spheres larger than 20µm were quantified. Bar graph, mean ± SD from duplicates of each 3 separate mice. (B) Mammary cells isolated from mice of the indicated genotypes were transplanted into the cleared MFPs of 3-week-old NSG mice. The mammary glands were dissected after 8 weeks and analyzed for the percentage of mammary fat pad filled. The bar graph represents the mean ± SD of N = 8 for WT, N = 5 for Brca1f/−;MC, N = 4 for p16−/−;Brca1f/−;MC and N = 4 for p16−/− mice examined for each group respectively.