Figures & data
Figure 1. (a) Scatterplot of differentially regulated H2BK120-ub peaks in mouse ESCs following shControl or shPhf5a knockdown, respectively. Red: Transcripts that significantly gain H2BK120-ub densities. Green: Transcripts that significantly lose H2BK120-ub densities. (b) Binding profiles for genomic distribution of H2BK120-ub peaks (Transcription start site (TSS), Gene body, Upstream (up to 100kb) and intergenic) in ESCs, showing preferential (90%) binding within gene bodies. (c) Statistically enriched gene ontology terms and canonical pathways using Metascape (http://metascape.org) for all significantly altered H2BK120-ub transcripts after shPhf5a depletion. (d) Protein-protein interaction network of representative terms after hierarchical clustering analysis using MCODE.Citation51 Each MCODE network node is assigned a unique color. Gene ontology enrichment analysis was applied to each MCODE network nodes to assign “meanings” to the network component. (e) Protein-protein interaction network of MCODE node components. Representative proteins include several core pluripotency factors that consist previously identified Paf1C targets.Citation22
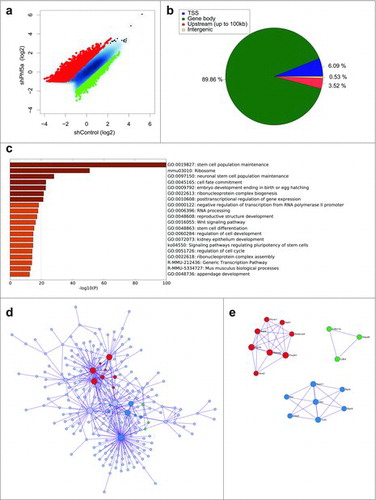
Figure 2. (a) Normalized read density profiles following Paf1 ChIP-sequencing centered on reference regions in the presence (blue) or absence (red) of Phf5a. (b) Box plots representing log2 fold change of normalized read density for H2BK120-ub, and H3K79me2 ChIP-sequencing in ESCs following shControl or shPhf5a silencing. Plots represent comparisons of all expressed transcripts in ESCs with housekeeping genes and also direct Paf1 targets around their gene bodies. **p<0.0001, non-parametric Wilcoxon signed rank test. (c) Normalized read density profiles around gene bodies, following ChIP-sequencing of H2BK120-ub and H3K79me2, on Paf1C targets and pluripotency genes in ESCs in the presence (blue) or absence (red) of Phf5a. (d) Venn diagram representing the numbers of genes in which H2BK120-ub densities are gained and H3K79me2 densities are lost, respectively, following shPhf5a depletion.
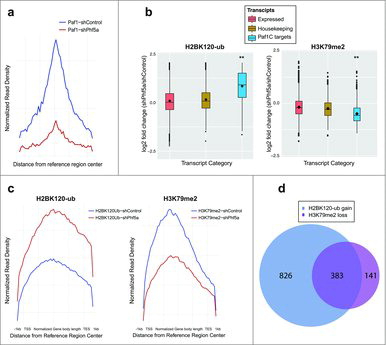
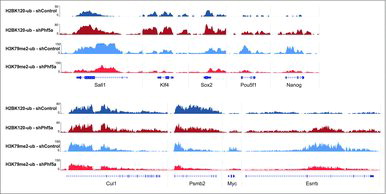
Figure 3. Genome browser snapshots of representative H2BK120-ub and H3K79me2 density ChIP-sequencing tracks on pluripotency genes or control loci. Dark blue: H2BK120-ub under conditions of shControl silencing. Dark red: H2BK120-ub under conditions of shPhf5a silencing. Light blue: H3K79me2 under conditions of shControl silencing. Light red: H3K79me2 under conditions of shPhf5a silencing.