1,948
Views
22
CrossRef citations to date
0
Altmetric
Report

Nrf2 promotes progression of non-small cell lung cancer through activating autophagy

, , , , , , , , , , , & show all
Pages 1053-1062 | Received 09 Nov 2016, Accepted 22 Mar 2017, Published online: 02 May 2017

Figures & data

Table 1. Baseline characteristics of patients.

Table 2. Multivariate analysis of factors affecting OS of patients.

Figure 1. Effect of Nrf2 staus, TNM, and tumor size on OS of NSCLC patients. Median survival time (MS) of NSCLC patients with Nrf2 (−) and Nrf2 (+) was 56 months (95% CI, 50.1 to 61.9) and 17 (95% CI, 14.76 to 19.25), respectively, P = 0.01. The MS of patients with TNM I, II and TNM III, IV was 56 months (95% CI, 50.73 to 61.27) and 17 (95% CI, 14.64 to 19.36), respectively, P = 0.00. The MS of patients with advanced TNM tumor size < 5cm and ≥ 5 cm was 43 months (95% CI, 31.43 to 54.57), and 17 (95% CI, 8.38 to 13.62), respectively, P = 0.00.
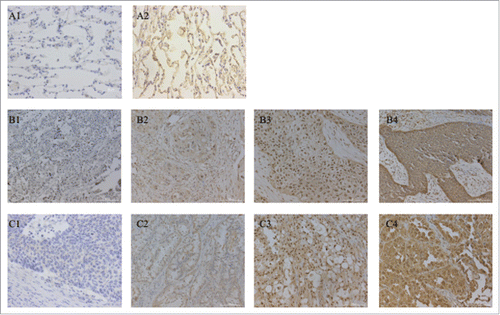
Figure 1. Effect of Nrf2 staus, TNM, and tumor size on OS of NSCLC patients. Median survival time (MS) of NSCLC patients with Nrf2 (−) and Nrf2 (+) was 56 months (95% CI, 50.1 to 61.9) and 17 (95% CI, 14.76 to 19.25), respectively, P = 0.01. The MS of patients with TNM I, II and TNM III, IV was 56 months (95% CI, 50.73 to 61.27) and 17 (95% CI, 14.64 to 19.36), respectively, P = 0.00. The MS of patients with advanced TNM tumor size < 5cm and ≥ 5 cm was 43 months (95% CI, 31.43 to 54.57), and 17 (95% CI, 8.38 to 13.62), respectively, P = 0.00.

Figure 2. Immunohistochemical staining of Nrf2 protein in NSCLC tissues (magnifcation, x200). Immunohistochemical expression of Nrf2 in paired normal lung tissues (A1-A2), lung adenocarcinoma (C1-C4) and lung squamous cell carcinoma (B1-B4). (B2,C2) weak expression, (B3,C3) moderate expression and (B4,C4) strong expression. Nrf2, NFE2-related factor 2; NSCLC, non-small cell lung cancer.
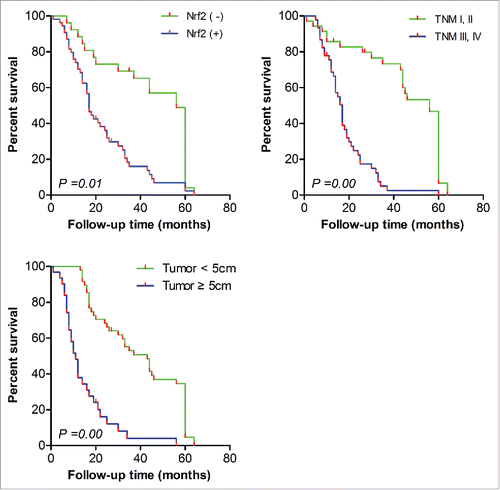
Figure 2. Immunohistochemical staining of Nrf2 protein in NSCLC tissues (magnifcation, x200). Immunohistochemical expression of Nrf2 in paired normal lung tissues (A1-A2), lung adenocarcinoma (C1-C4) and lung squamous cell carcinoma (B1-B4). (B2,C2) weak expression, (B3,C3) moderate expression and (B4,C4) strong expression. Nrf2, NFE2-related factor 2; NSCLC, non-small cell lung cancer.

Figure 3. The expression of Nrf2 in human NSCLC cell lines. (A) The expression of Nrf2 detected by Western blot in different cell lines; (B) Western blot analysis for Nrf2 protein expression in Nrf2 pcDNA-affected 95D and shRNA-transfected A549 NSCLC cells; (C) Quantifcation of the relative expression(Nrf2/β-actin) of Nrf2 in NSCLC cells. (D)Quantifcation of the relative expression(Nrf2/β-actin) of Nrf2 protein in Nrf2 pcDNA-affected 95D and shRNA-transfected A549 NSCLC cells. The data are presented as mean ± SD of 3 independent experiments.The bar graph shows the relative protein expression (Nrf2/β-Actin in each cell line, *, P < 0.05, **, P < 0.01 compared with the control cells).
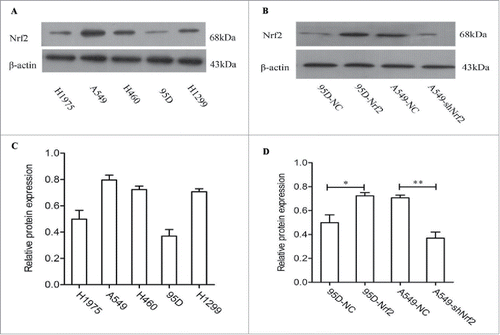
Figure 3. The expression of Nrf2 in human NSCLC cell lines. (A) The expression of Nrf2 detected by Western blot in different cell lines; (B) Western blot analysis for Nrf2 protein expression in Nrf2 pcDNA-affected 95D and shRNA-transfected A549 NSCLC cells; (C) Quantifcation of the relative expression(Nrf2/β-actin) of Nrf2 in NSCLC cells. (D)Quantifcation of the relative expression(Nrf2/β-actin) of Nrf2 protein in Nrf2 pcDNA-affected 95D and shRNA-transfected A549 NSCLC cells. The data are presented as mean ± SD of 3 independent experiments.The bar graph shows the relative protein expression (Nrf2/β-Actin in each cell line, *, P < 0.05, **, P < 0.01 compared with the control cells).

Figure 4. Effects of Nrf2 expression on the proliferation of NSCLC cells in vitro. (A) MTT assay; (B) Colony formation assay. Colonies were counted 14 d later and the number of cells in a colony is more than 50; (C) Cell cycle distribution was analyzed by flow cytometry; (D) Apoptotic and necrotic cells were counted by flow cytometry. Data are presented as mean ± SD of 3 independent experiments. (*, P < 0.05; **, P < 0.01 and ***, P < 0.001 VS.the corressponding control).
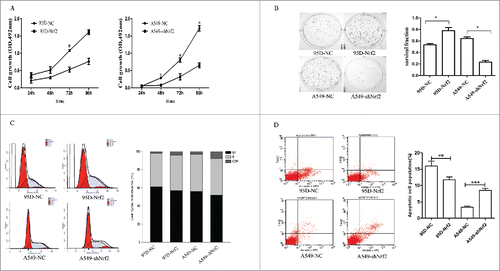
Figure 4. Effects of Nrf2 expression on the proliferation of NSCLC cells in vitro. (A) MTT assay; (B) Colony formation assay. Colonies were counted 14 d later and the number of cells in a colony is more than 50; (C) Cell cycle distribution was analyzed by flow cytometry; (D) Apoptotic and necrotic cells were counted by flow cytometry. Data are presented as mean ± SD of 3 independent experiments. (*, P < 0.05; **, P < 0.01 and ***, P < 0.001 VS.the corressponding control).

Figure 5. Activities of Nrf2 in NSCLC cells in tumor xenograft models. (A) Photomicrograph of tumors in the different treatment groups; (B) Tumor growth curve in different groups; (C) Immunohistochemical analysis of Nrf2 and autophagy related genes in tumor xenografts. Nrf2 expression in xenografts resulted in the upregulation of beclin1 and LC3 expression (× 200 magnification). Data are presented as mean ± SD of 3 independent experiments. (*, P < 0.05, **, P < 0.01).
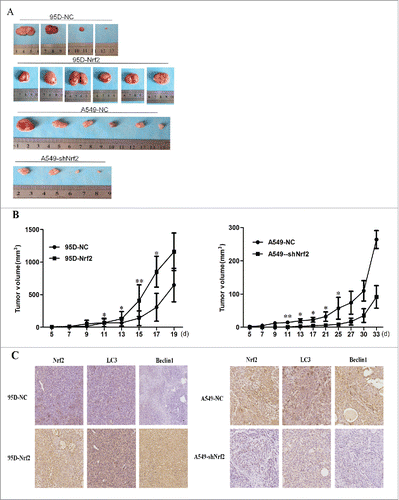
Figure 5. Activities of Nrf2 in NSCLC cells in tumor xenograft models. (A) Photomicrograph of tumors in the different treatment groups; (B) Tumor growth curve in different groups; (C) Immunohistochemical analysis of Nrf2 and autophagy related genes in tumor xenografts. Nrf2 expression in xenografts resulted in the upregulation of beclin1 and LC3 expression (× 200 magnification). Data are presented as mean ± SD of 3 independent experiments. (*, P < 0.05, **, P < 0.01).

Figure 6. Nrf2 promotes autophagy in NSCLC cells. (A) Endogenous ROS levels in NSCLC cell lines with DCF-DA probe. The intensity fluorescence were counted by flow cytumetry, and the mean intensity of fluorescence in the cells with different groups represents endogenous ROS levels in NSCLC cell lines; (B) Western blot analysis of autophagy-related genes; C. Effects of Nrf2 expression on the regulation of the number of autophagosome with TEM. Data are presented as mean ± SD of 3 independent experiments.
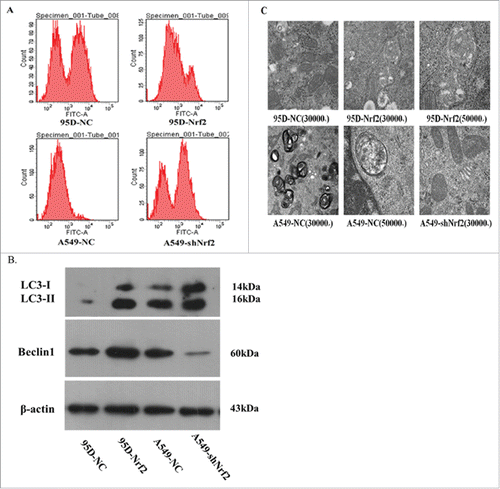
Figure 6. Nrf2 promotes autophagy in NSCLC cells. (A) Endogenous ROS levels in NSCLC cell lines with DCF-DA probe. The intensity fluorescence were counted by flow cytumetry, and the mean intensity of fluorescence in the cells with different groups represents endogenous ROS levels in NSCLC cell lines; (B) Western blot analysis of autophagy-related genes; C. Effects of Nrf2 expression on the regulation of the number of autophagosome with TEM. Data are presented as mean ± SD of 3 independent experiments.

Figure 7. Effect of ROS on expression of Nrf2. (A) Flow cytometry verified that the level of intracellular ROS in cancer cells gradually increased along with high concentration of H2O2. (B) After treatment A549 cells with H2O2 for 24h. The results showed that the expression of Nrf2 increased after treating with ROS in dose dependent manner.
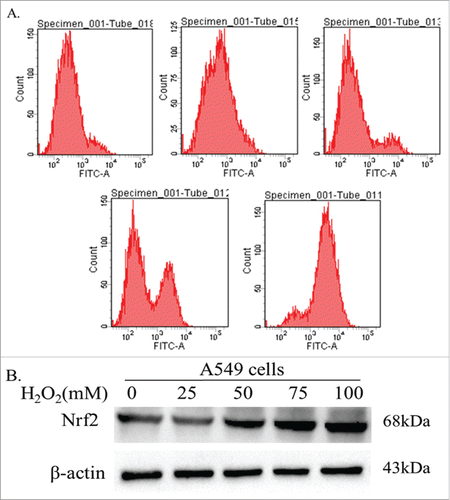
Figure 7. Effect of ROS on expression of Nrf2. (A) Flow cytometry verified that the level of intracellular ROS in cancer cells gradually increased along with high concentration of H2O2. (B) After treatment A549 cells with H2O2 for 24h. The results showed that the expression of Nrf2 increased after treating with ROS in dose dependent manner.

Figure 8. Nrf2 promotes NSCLC cell proliferation by activing autophagy. Western blotting for LC3I/II and Beclin1 in 95D-Nrf2 cells treated with 3-MA (0,2.5,5,10 mmol/L); B. Effects of inhibited autophagy on the regulation of the proportions of apoptotic cells in 95D-Nrf2 cells. Apoptosis 005,control (95D-Nrf2 cells untreated with 3-MA); Apoptosis 006,007,008, 95D-Nrf2/3-MA(95D-Nrf2 cells treated with 2.5,5,10 mmol/L 3-MA,respectively). Data are presented as mean ± SD of 3 independent experiments. *, P < 0.05 compared with the control cells.
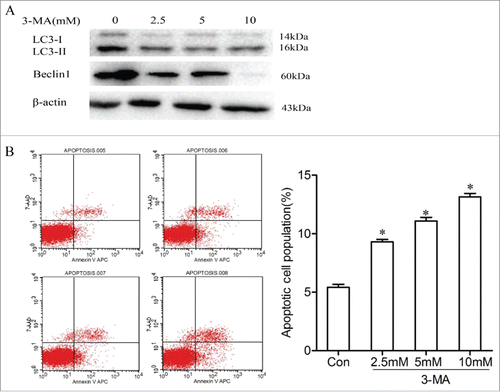
Figure 8. Nrf2 promotes NSCLC cell proliferation by activing autophagy. Western blotting for LC3I/II and Beclin1 in 95D-Nrf2 cells treated with 3-MA (0,2.5,5,10 mmol/L); B. Effects of inhibited autophagy on the regulation of the proportions of apoptotic cells in 95D-Nrf2 cells. Apoptosis 005,control (95D-Nrf2 cells untreated with 3-MA); Apoptosis 006,007,008, 95D-Nrf2/3-MA(95D-Nrf2 cells treated with 2.5,5,10 mmol/L 3-MA,respectively). Data are presented as mean ± SD of 3 independent experiments. *, P < 0.05 compared with the control cells.

Reprints and Corporate Permissions

Please note: Selecting permissions does not provide access to the full text of the article, please see our help page How do I view content?

To request a reprint or corporate permissions for this article, please click on the relevant link below:

Academic Permissions

Please note: Selecting permissions does not provide access to the full text of the article, please see our help page How do I view content?

Obtain permissions instantly via Rightslink by clicking on the button below:

If you are unable to obtain permissions via Rightslink, please complete and submit this Permissions form. For more information, please visit our Permissions help page.