1,524
Views
43
CrossRef citations to date
0
Altmetric
Reports

Activation of Notch pathway is linked with epithelial-mesenchymal transition in prostate cancer cells

, , , , &
Pages 999-1007 | Received 24 Feb 2017, Accepted 22 Mar 2017, Published online: 20 Apr 2017

Figures & data

Figure 1. Activation of Notch-1 in PC-3 cells. (A) Western blotting was used to detect the expression of Notch-1 in prostate cancer cells. PC-3 ICN: PC-3 with ICN plasmid transfection. (B) Immunofluorescence was performed in PC-3 cells with ICN transfection. (C) Western blotting analysis was conducted to measure the expression of Notch-1 targets in prostate cancer cells. (D) Real-time RT-PCR was performed to detect the mRNA levels of Notch-1 targets in prostate cancer cells. *P<0.05; **P<0.01 vs PC-3 cells.
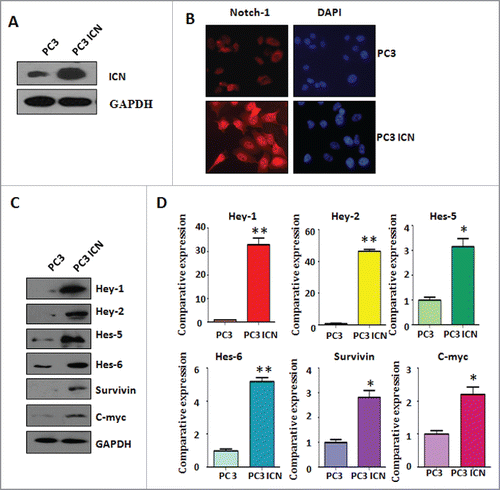
Figure 1. Activation of Notch-1 in PC-3 cells. (A) Western blotting was used to detect the expression of Notch-1 in prostate cancer cells. PC-3 ICN: PC-3 with ICN plasmid transfection. (B) Immunofluorescence was performed in PC-3 cells with ICN transfection. (C) Western blotting analysis was conducted to measure the expression of Notch-1 targets in prostate cancer cells. (D) Real-time RT-PCR was performed to detect the mRNA levels of Notch-1 targets in prostate cancer cells. *P<0.05; **P<0.01 vs PC-3 cells.

Figure 2. Overexpression of Notch enhanced cell migration and invasion. (A) Cell detachment and attachment were measured in PC-3 ICN cells. *P<0.05 vs PC-3 cells. (B) Wound healing assay was applied for detection of cell migration in PC-3 cells with ICN transfection. (C) Left panel: Matrigel migration and invasion chamber assays were performed to examine the invasive activity of PC-3 cells transfected with ICN. Right panel: quantitative results are illustrated for left panel. *P<0.05 vs PC-3 cells.
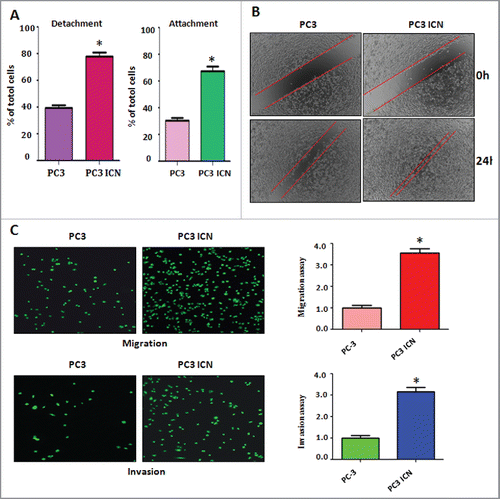
Figure 2. Overexpression of Notch enhanced cell migration and invasion. (A) Cell detachment and attachment were measured in PC-3 ICN cells. *P<0.05 vs PC-3 cells. (B) Wound healing assay was applied for detection of cell migration in PC-3 cells with ICN transfection. (C) Left panel: Matrigel migration and invasion chamber assays were performed to examine the invasive activity of PC-3 cells transfected with ICN. Right panel: quantitative results are illustrated for left panel. *P<0.05 vs PC-3 cells.

Figure 3. Down-regulation of Notch-1 retarded cell migration and invasion. (A) Western blotting was conducted to measure the efficacy of Notch-1 siRNA for knocking down Notch-1 in PC-3 cells. CS: control siRNA; NS: Notch-1 siRNA. (B) Cell detachment and attachment were measured in PC-3 cells transfected with Notch-1 siRNA. *P<0.05 vs PC-3 cells. (C) Left panel: Matrigel migration and invasion chamber assays were conducted to detect the invasive activity of PC-3 cells transfected with Notch-1 siRNA. Right panel: quantitative results are illustrated for left panel. *P<0.05 vs control.
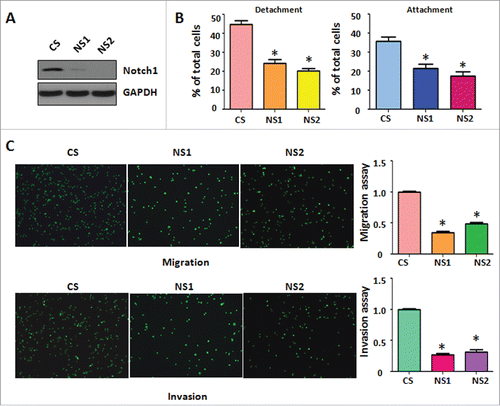
Figure 3. Down-regulation of Notch-1 retarded cell migration and invasion. (A) Western blotting was conducted to measure the efficacy of Notch-1 siRNA for knocking down Notch-1 in PC-3 cells. CS: control siRNA; NS: Notch-1 siRNA. (B) Cell detachment and attachment were measured in PC-3 cells transfected with Notch-1 siRNA. *P<0.05 vs PC-3 cells. (C) Left panel: Matrigel migration and invasion chamber assays were conducted to detect the invasive activity of PC-3 cells transfected with Notch-1 siRNA. Right panel: quantitative results are illustrated for left panel. *P<0.05 vs control.

Figure 4. PC-3 ICN cells have the morphologic changes and EMT feature. (A) The PC-3 and PC-3 ICN cells were photographed under the microscope. (B) Western blotting was conducted to measure the protein levels of EMT markers in PC-3 ICN cells. (C) Real-time RT-PCR was performed to detect the mRNA levels of EMT markers in prostate cancer cells. *P<0.05; **P<0.01 vs PC-3 cells.
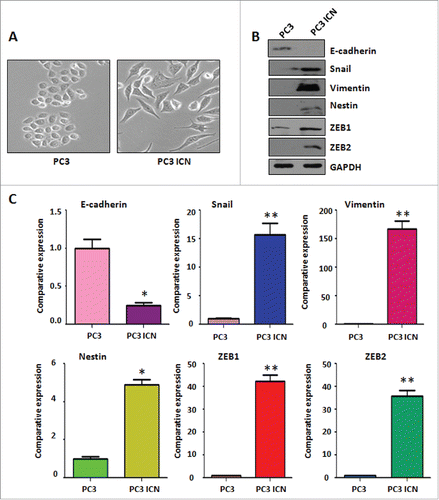
Figure 4. PC-3 ICN cells have the morphologic changes and EMT feature. (A) The PC-3 and PC-3 ICN cells were photographed under the microscope. (B) Western blotting was conducted to measure the protein levels of EMT markers in PC-3 ICN cells. (C) Real-time RT-PCR was performed to detect the mRNA levels of EMT markers in prostate cancer cells. *P<0.05; **P<0.01 vs PC-3 cells.

Figure 5. PC-3 ICN cells have the EMT marker changes. Immunofluorescence was conducted to measure the expression of EMT markers in prostate cancer cells.
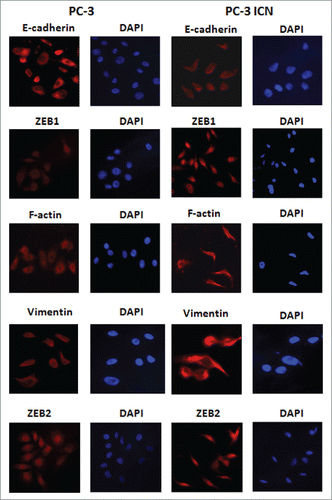
Figure 5. PC-3 ICN cells have the EMT marker changes. Immunofluorescence was conducted to measure the expression of EMT markers in prostate cancer cells.

Figure 6. PC-3 ICN cells have increased the formation of prostate cancer spheres. (A) The PC-3 ICN cells with Notch-1 siRNA transfection were photographed under the microscope. CS: control siRNA; NS: Notch-1 siRNA. (B) Western blotting was conducted to measure the protein levels of CSC markers in PC-3 ICN cells after Notch-1 siRNA transfection. (C) The formation of sphere was photographed under the microscope in PC-3 ICN cells. (D) The formation of sphere was photographed in PC-3 ICN cells with Notch-1 siRNA transfection. (E) Left panel: Real-time RT-PCR was performed to detect the mRNA levels of CSC markers in prostate cancer cells. *P<0.05; **P<0.01 vs PC-3 cells. Right panel: Western blotting analysis was used to measure the protein levels of CSC markers in prostate cancer cells.
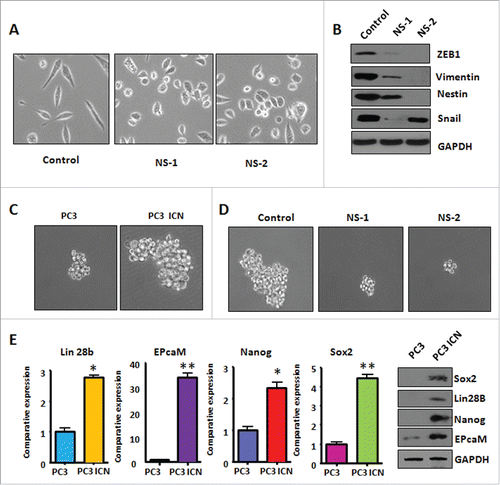
Figure 6. PC-3 ICN cells have increased the formation of prostate cancer spheres. (A) The PC-3 ICN cells with Notch-1 siRNA transfection were photographed under the microscope. CS: control siRNA; NS: Notch-1 siRNA. (B) Western blotting was conducted to measure the protein levels of CSC markers in PC-3 ICN cells after Notch-1 siRNA transfection. (C) The formation of sphere was photographed under the microscope in PC-3 ICN cells. (D) The formation of sphere was photographed in PC-3 ICN cells with Notch-1 siRNA transfection. (E) Left panel: Real-time RT-PCR was performed to detect the mRNA levels of CSC markers in prostate cancer cells. *P<0.05; **P<0.01 vs PC-3 cells. Right panel: Western blotting analysis was used to measure the protein levels of CSC markers in prostate cancer cells.

Reprints and Corporate Permissions

Please note: Selecting permissions does not provide access to the full text of the article, please see our help page How do I view content?

To request a reprint or corporate permissions for this article, please click on the relevant link below:

Academic Permissions

Please note: Selecting permissions does not provide access to the full text of the article, please see our help page How do I view content?

Obtain permissions instantly via Rightslink by clicking on the button below:

If you are unable to obtain permissions via Rightslink, please complete and submit this Permissions form. For more information, please visit our Permissions help page.