1,233
Views
4
CrossRef citations to date
0
Altmetric
Report

Identification of SSEA-1 expressing enhanced reprogramming (SEER) cells in porcine embryonic fibroblasts

, , ORCID Icon, , , ORCID Icon, , & ORCID Icon show all
Pages 1070-1084 | Received 30 Jan 2017, Accepted 30 Mar 2017, Published online: 27 Apr 2017

Figures & data

Figure 1. Expression of cell surface makers in porcine embryonic fibroblasts (pEFs) from different breeds. (A) Chromogen immunocytochemistry staining (ICC) representative of pEFs from each breed. Scale bar represents 100 μm. Arrows mark positively labeled cells. (B) Representative immunocytochemical staining of SSEA-4 positive (+) cells in Danish Landrace and Yucatan pEFs. Scale bar represents 100 μm. (C) Mean cell populations (%) of SSEA-1, SSEA-4 and CD105 fibroblasts for pEFs from all breeds.
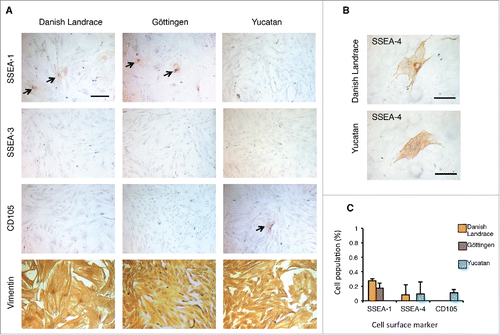
Figure 1. Expression of cell surface makers in porcine embryonic fibroblasts (pEFs) from different breeds. (A) Chromogen immunocytochemistry staining (ICC) representative of pEFs from each breed. Scale bar represents 100 μm. Arrows mark positively labeled cells. (B) Representative immunocytochemical staining of SSEA-4 positive (+) cells in Danish Landrace and Yucatan pEFs. Scale bar represents 100 μm. (C) Mean cell populations (%) of SSEA-1, SSEA-4 and CD105 fibroblasts for pEFs from all breeds.

Table 2. Porcine-specific primers used in quantitative PCR to detect endogenous gene expression in the putative piPSCs and to validate microarray analyses.

Table 1. Immunocytochemical analysis and quantification of cell surface markers in porcine embryonic fibroblasts from different cell lines and breeds.

Figure 2. Reprogramming of porcine embryonic fibroblasts (pEFs) from different breeds reveals differences between lines and breeds. (A) Schematic of the episomal plasmid-based reprogramming protocol. (B) Alkaline phosphatase (AP) positive (+) colony forming units with ESC like morphology (CFUs) in 3 representative pEF lines in the different breeds. (C) Total mean number of AP+ CFUs for each cell line. Data was collected from 3 independent episomal plasmid-based reprogramming and averaged (n = 3) as mean ± standard deviation and tested for significance using the students t-test (p < 0.05). Asterix and bar denotes significance was obtained from Y2 when compared with G3. Likewise, all D and G cell lines were found to be significantly different from the Y lines.
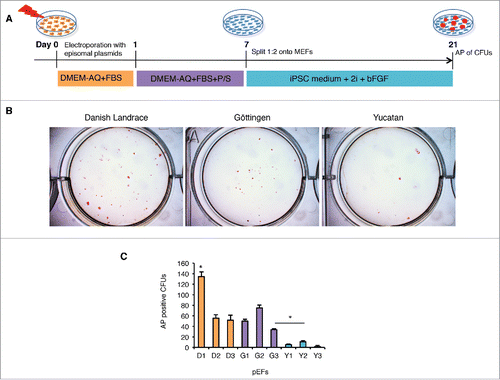
Figure 2. Reprogramming of porcine embryonic fibroblasts (pEFs) from different breeds reveals differences between lines and breeds. (A) Schematic of the episomal plasmid-based reprogramming protocol. (B) Alkaline phosphatase (AP) positive (+) colony forming units with ESC like morphology (CFUs) in 3 representative pEF lines in the different breeds. (C) Total mean number of AP+ CFUs for each cell line. Data was collected from 3 independent episomal plasmid-based reprogramming and averaged (n = 3) as mean ± standard deviation and tested for significance using the students t-test (p < 0.05). Asterix and bar denotes significance was obtained from Y2 when compared with G3. Likewise, all D and G cell lines were found to be significantly different from the Y lines.

Figure 3. Characterization of pluripotency in the Danish Landrace (D)–piPSC-like and Yucatan (Y)-piPSC-like clones. (A) Morphology of representative D-piPSC-like and Y-piPSC-like colonies. Scale bar represents 100 µm. (B) Expression of pluripotent markers in D-piPSC-like and Y-piPSC-like cells. (C) Quantitative real-time PCR for the endogenous pluripotency markers NANOG, OCT4, SOX2 and LIN28 in D-piPSCs and Y-piPSCs. Expression values were normalized to RPL4 and TCF3, and fold change was calculated using 2−ΔΔCT. Data is shown as mean and error bars denote the standard deviation. Asterisk indicates statistically significant differences (p < 0.05) in different cell lines within each gene analyzed. Error bar indicates D-piPSC is significantly different from pEF-D. (D) Embryoid bodies from the D-piPSCs and Y-piPSCs differed slightly size but most importantly in their ability to plate onto plastic substrates in vitro. (E) In vitro differentiation of D-iPSCs and Y-piPSCs reveal both cells can differentiate into all 3 germ lineages. Scale bar represents 200 µm.
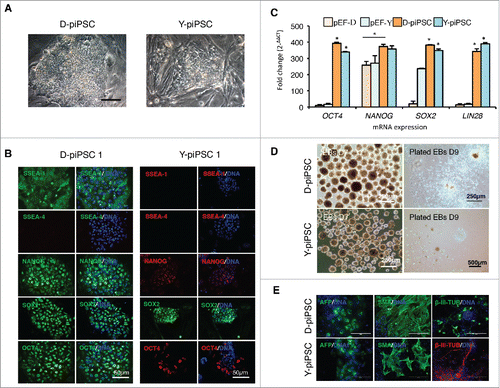
Figure 3. Characterization of pluripotency in the Danish Landrace (D)–piPSC-like and Yucatan (Y)-piPSC-like clones. (A) Morphology of representative D-piPSC-like and Y-piPSC-like colonies. Scale bar represents 100 µm. (B) Expression of pluripotent markers in D-piPSC-like and Y-piPSC-like cells. (C) Quantitative real-time PCR for the endogenous pluripotency markers NANOG, OCT4, SOX2 and LIN28 in D-piPSCs and Y-piPSCs. Expression values were normalized to RPL4 and TCF3, and fold change was calculated using 2−ΔΔCT. Data is shown as mean and error bars denote the standard deviation. Asterisk indicates statistically significant differences (p < 0.05) in different cell lines within each gene analyzed. Error bar indicates D-piPSC is significantly different from pEF-D. (D) Embryoid bodies from the D-piPSCs and Y-piPSCs differed slightly size but most importantly in their ability to plate onto plastic substrates in vitro. (E) In vitro differentiation of D-iPSCs and Y-piPSCs reveal both cells can differentiate into all 3 germ lineages. Scale bar represents 200 µm.

Figure 4. Reprogramming of SSEA-1 positive cells reveals enhanced reprogramming capabilites. (A) Schematic of reprogramming SSEA-1+, SSEA-1neg and unsorted D1 pEFs using lentiviral transfection. (B) Flow cytometry analysis of SSEA-1+ cell fraction in D1 pEFs. (C) Representative Alkaline Phosphatase positive (AP+) colony forming unit with ESC-like morphology (CFU) derived from D1 SSEA-1+ cells 21 d post transduction. (D) Number of AP+ CFUs derived from the 3 cell populations. (E) Schematic of magnetic cell sorting (MACS) targeting SSEA-1+ cell fraction and subsequent episomal plasmid-based reprogramming of SSEA-1+ and SSEA-1neg fractions. (F) Total mean number of AP+ CFUs derived from MACS sorted SSEA-1+ and SSEA-1neg fractions. (G) Representative image of AP+ CFUs from MACS sorted SSEA-1+ and SSEA-1neg fractions.
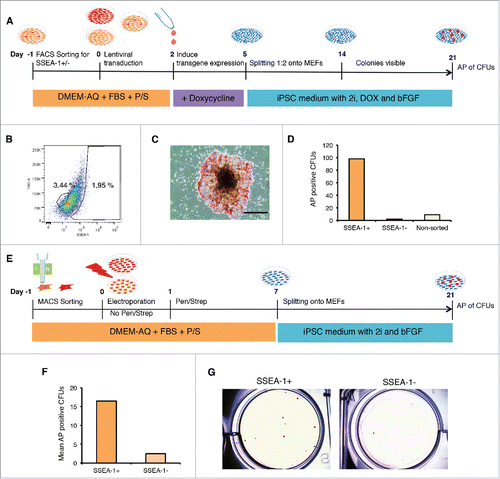
Figure 4. Reprogramming of SSEA-1 positive cells reveals enhanced reprogramming capabilites. (A) Schematic of reprogramming SSEA-1+, SSEA-1neg and unsorted D1 pEFs using lentiviral transfection. (B) Flow cytometry analysis of SSEA-1+ cell fraction in D1 pEFs. (C) Representative Alkaline Phosphatase positive (AP+) colony forming unit with ESC-like morphology (CFU) derived from D1 SSEA-1+ cells 21 d post transduction. (D) Number of AP+ CFUs derived from the 3 cell populations. (E) Schematic of magnetic cell sorting (MACS) targeting SSEA-1+ cell fraction and subsequent episomal plasmid-based reprogramming of SSEA-1+ and SSEA-1neg fractions. (F) Total mean number of AP+ CFUs derived from MACS sorted SSEA-1+ and SSEA-1neg fractions. (G) Representative image of AP+ CFUs from MACS sorted SSEA-1+ and SSEA-1neg fractions.

Figure 5. This data are based on 5 biologic replicates (A) The significantly differentially expressed Genes from the Volcano Plot built by comparing “SSEA-1+ vs SSEA-1-neg,” using Multiple Testing Correction: Benjamini and Hochberg False Discovery Rate. Differentially expressed genes were defined by Fold Difference: 1.2 and a P-value Cutoff: 0.05. (B) A gene condition tree heat map clustering of all genes was built by comparing “SSEA-1+ vs SSEA-1-neg.” Similarity Measurement, Distance. The clustering algorithm was performed using average linkage. (C) Gene condition tree heat map clustering of all genes built by comparing “SSEA-1+ vs SSEA-1-neg.” Discarded genes with no gene symbol annotation from the starting conditions. Rows are centered; unit variance scaling is applied to rows. Both rows and columns are clustered using correlation distance and average linkage.
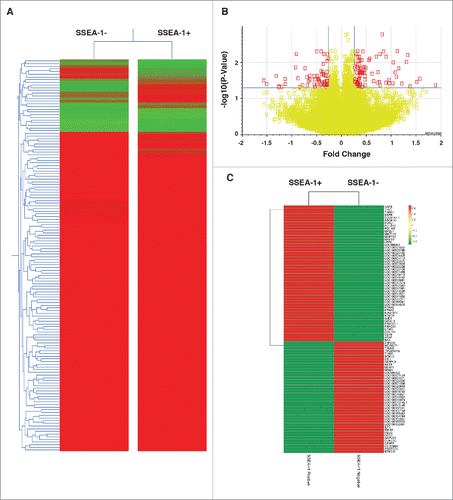
Figure 5. This data are based on 5 biologic replicates (A) The significantly differentially expressed Genes from the Volcano Plot built by comparing “SSEA-1+ vs SSEA-1-neg,” using Multiple Testing Correction: Benjamini and Hochberg False Discovery Rate. Differentially expressed genes were defined by Fold Difference: 1.2 and a P-value Cutoff: 0.05. (B) A gene condition tree heat map clustering of all genes was built by comparing “SSEA-1+ vs SSEA-1-neg.” Similarity Measurement, Distance. The clustering algorithm was performed using average linkage. (C) Gene condition tree heat map clustering of all genes built by comparing “SSEA-1+ vs SSEA-1-neg.” Discarded genes with no gene symbol annotation from the starting conditions. Rows are centered; unit variance scaling is applied to rows. Both rows and columns are clustered using correlation distance and average linkage.

Figure 6. (A) Biological processes enrichment categories graph gene ontology in SSEA-1+ and SSEA-1neg upregulated genes. (B) Functional association interaction network of upregulated genes in SSEA-1+ vs SSEA-1neg, using protein and genetic interactions, pathways, co-expression, co-localization, protein domain and physical interaction data (Cytoscape-GeneMANIA, University of Toronto, Donnelly Center for Cellular and Biomolecular Research, www.genemania.org). (C) GeneMANIA functional association Cytoscape diagram (University of Toronto, Donnelly Center for Cellular and Biomolecular Research, www.genemania.org), association data of upregulated gene interaction with SSEA-1+ vs SSEA-1neg porcine embryonic fibroblasts (pEFS), which includes protein and genetic interaction pathways, co-expression, co-localization and protein domain similarity.
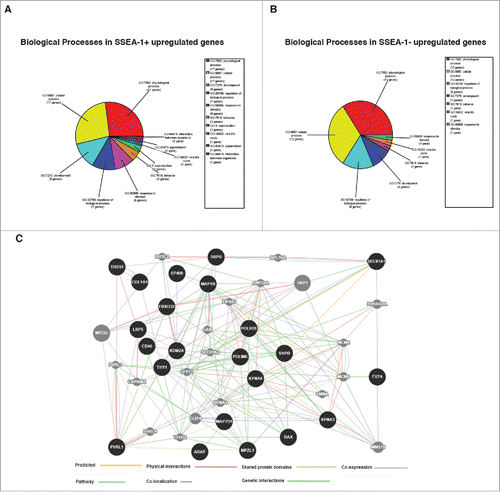
Figure 6. (A) Biological processes enrichment categories graph gene ontology in SSEA-1+ and SSEA-1neg upregulated genes. (B) Functional association interaction network of upregulated genes in SSEA-1+ vs SSEA-1neg, using protein and genetic interactions, pathways, co-expression, co-localization, protein domain and physical interaction data (Cytoscape-GeneMANIA, University of Toronto, Donnelly Center for Cellular and Biomolecular Research, www.genemania.org). (C) GeneMANIA functional association Cytoscape diagram (University of Toronto, Donnelly Center for Cellular and Biomolecular Research, www.genemania.org), association data of upregulated gene interaction with SSEA-1+ vs SSEA-1neg porcine embryonic fibroblasts (pEFS), which includes protein and genetic interaction pathways, co-expression, co-localization and protein domain similarity.

Figure 7. Differentiation of magnetic sorted SSEA-1+ and SSEA-1neg D1 porcine embryonic fibroblasts (pEFSs) reveals enhanced differentiation into osteocytes and chondrocytes for SSEA-1+ populations. (A) Schematic representation of differentiation into mesenchymal cell lineages. (B) Both SSEA-1+ and SSEA-1neg cell fractions could undergo osteogenic and chrondrogenic differentiation following differentiation for 28 d. (C) Quantification of osteogenic differentiation was performed by reading absorbance levels of Alizarin red and revealed a higher propensity of differentiation in the SSEA-1+ cell fraction compared with the SSEA-1neg cell fraction. (D) Quantitative analyses of Alcian Blue revealed SSEA-1+ cells differentiated more proficiently than SSEA-1neg cells.
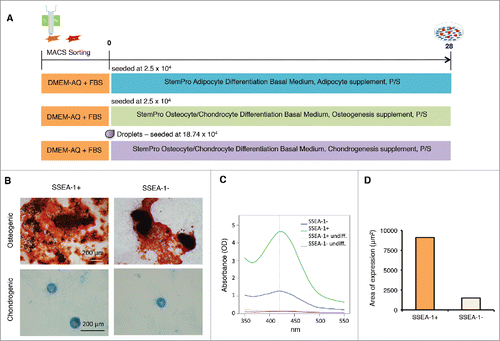
Figure 7. Differentiation of magnetic sorted SSEA-1+ and SSEA-1neg D1 porcine embryonic fibroblasts (pEFSs) reveals enhanced differentiation into osteocytes and chondrocytes for SSEA-1+ populations. (A) Schematic representation of differentiation into mesenchymal cell lineages. (B) Both SSEA-1+ and SSEA-1neg cell fractions could undergo osteogenic and chrondrogenic differentiation following differentiation for 28 d. (C) Quantification of osteogenic differentiation was performed by reading absorbance levels of Alizarin red and revealed a higher propensity of differentiation in the SSEA-1+ cell fraction compared with the SSEA-1neg cell fraction. (D) Quantitative analyses of Alcian Blue revealed SSEA-1+ cells differentiated more proficiently than SSEA-1neg cells.
Supplemental material

KCCY_A_1315490_Supplemental.zip

Download Zip (34.8 KB)

Reprints and Corporate Permissions

Please note: Selecting permissions does not provide access to the full text of the article, please see our help page How do I view content?

To request a reprint or corporate permissions for this article, please click on the relevant link below:

Academic Permissions

Please note: Selecting permissions does not provide access to the full text of the article, please see our help page How do I view content?

Obtain permissions instantly via Rightslink by clicking on the button below:

If you are unable to obtain permissions via Rightslink, please complete and submit this Permissions form. For more information, please visit our Permissions help page.