1,512
Views
9
CrossRef citations to date
0
Altmetric
Report

EMAP-II sensitize U87MG and glioma stem-like cells to temozolomide via induction of autophagy-mediated cell death and G2/M arrest

ORCID Icon, , , , &
Pages 1085-1092 | Received 01 Feb 2017, Accepted 30 Mar 2017, Published online: 05 May 2017

Figures & data

Figure 1. EMAP-II enhanced cytotoxic effect of TMZ on U87MG and GSCs (A) U87MG cells were cultured in the DMEM, containing 10% FBS in flasks. After sorted by FACS, the CD133-positive cells were collected and maintained in the DMEM/F12, containing 2% B27 supplements, 20ng/ml EGF, and bFGF. Suspended cells became spheres after 48 h culture. (B) GSCs expressing the stemness biomarkers of CD133 and Nestin by immunofluorescence. (C) Both U87MG and GSCs were treated with TMZ alone or a combination of TMZ and EMAP-II with assigned concentration for 72 h respectively, IC50 of TMZ calculated from dose-inhibition response curves was remarkably decreased on both U87MG and GSCs. (D) Cells were treated with 100μM TMZ and/or 0.5 nM EMAP-II for 72 h respectively and cell viability was then determined. EMAP-II enhanced the TMZ-induced cytotoxic effect on U87MG and GSCs.
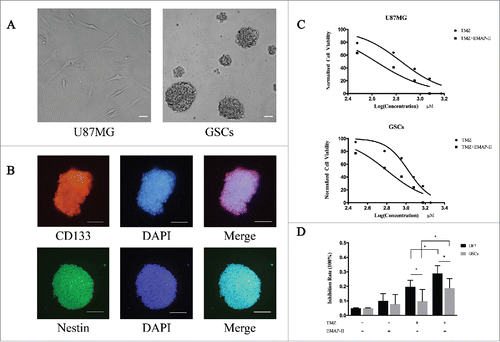
Figure 1. EMAP-II enhanced cytotoxic effect of TMZ on U87MG and GSCs (A) U87MG cells were cultured in the DMEM, containing 10% FBS in flasks. After sorted by FACS, the CD133-positive cells were collected and maintained in the DMEM/F12, containing 2% B27 supplements, 20ng/ml EGF, and bFGF. Suspended cells became spheres after 48 h culture. (B) GSCs expressing the stemness biomarkers of CD133 and Nestin by immunofluorescence. (C) Both U87MG and GSCs were treated with TMZ alone or a combination of TMZ and EMAP-II with assigned concentration for 72 h respectively, IC50 of TMZ calculated from dose-inhibition response curves was remarkably decreased on both U87MG and GSCs. (D) Cells were treated with 100μM TMZ and/or 0.5 nM EMAP-II for 72 h respectively and cell viability was then determined. EMAP-II enhanced the TMZ-induced cytotoxic effect on U87MG and GSCs.

Figure 2. EMAP-II increased TMZ-induced autophagy (A) U87MG was treated with either TMZ or EMAP-II and both TMZ and EMAP-II for 72 h respectively. Expression and distribution of LC3B II were determined by immunofluorescence staining, all images were taken with exactly the same settings. Compared to the control, cells treated with either EMAP-II or TMZ both showed an obvious higher level of LC3BII expression, and cells treated with both EMAP-II and TMZ showed even higher LC3BII staining. (scale bar = 20μM). (B-D) U87MG was treated with either TMZ or EMAP-II and both TMZ and EMAP-II for 72 h. TMZ induced a higher LC3BII/LC3BIlevel than EMAP-II; Combination of TMZ and EMAP-II showed a significant elevation on LC3BII/LC3BIthan either TMZ or EMAP-II; P62/SQSTM1 was obviously inhibited by combination of TMZ and EMAP-II;(E-G) GSCs was treated with either TMZ or EMAP-II and both TMZ and EMAP-II for 72 h. The combination of TMZ and EMAP-II showed a significant elevation on LC3BII/LC3BIthan either TMZ or EMAP-II; P62/SQSTM1 was obviously inhibited by the combination of TMZ and EMAP-II; Values present means ± SD (n = 3, each). *p < 0.05, **p < 0.01, or ***p < 0.001.
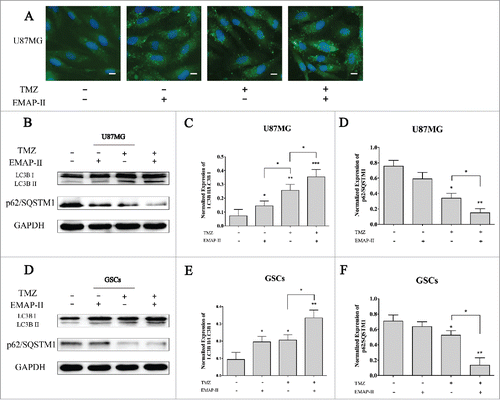
Figure 2. EMAP-II increased TMZ-induced autophagy (A) U87MG was treated with either TMZ or EMAP-II and both TMZ and EMAP-II for 72 h respectively. Expression and distribution of LC3B II were determined by immunofluorescence staining, all images were taken with exactly the same settings. Compared to the control, cells treated with either EMAP-II or TMZ both showed an obvious higher level of LC3BII expression, and cells treated with both EMAP-II and TMZ showed even higher LC3BII staining. (scale bar = 20μM). (B-D) U87MG was treated with either TMZ or EMAP-II and both TMZ and EMAP-II for 72 h. TMZ induced a higher LC3BII/LC3BIlevel than EMAP-II; Combination of TMZ and EMAP-II showed a significant elevation on LC3BII/LC3BIthan either TMZ or EMAP-II; P62/SQSTM1 was obviously inhibited by combination of TMZ and EMAP-II;(E-G) GSCs was treated with either TMZ or EMAP-II and both TMZ and EMAP-II for 72 h. The combination of TMZ and EMAP-II showed a significant elevation on LC3BII/LC3BIthan either TMZ or EMAP-II; P62/SQSTM1 was obviously inhibited by the combination of TMZ and EMAP-II; Values present means ± SD (n = 3, each). *p < 0.05, **p < 0.01, or ***p < 0.001.

Figure 3. Effect on the cell progression. After U87MG and GSCs were treated with either TMZ or EMAP-II and combination of TMZ with EMAP-II for 72 h, the cell population in different phase were determined by flow cytometry. (A-B) U87MG treated with TMZ showed an increased proportion of the G2/M population, combined TMZ and EMAP-II induced a higher G2/M accumulation than TMZ. (C-D) GSCs treated TMZ did not show an increased proportion of the G2/M population. only combined TMZ and EMAP-II induced a higher G2/M accumulation. The values present means ± SD (n = 4, each). *p < 0.05
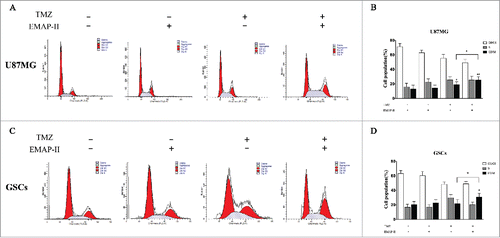
Figure 3. Effect on the cell progression. After U87MG and GSCs were treated with either TMZ or EMAP-II and combination of TMZ with EMAP-II for 72 h, the cell population in different phase were determined by flow cytometry. (A-B) U87MG treated with TMZ showed an increased proportion of the G2/M population, combined TMZ and EMAP-II induced a higher G2/M accumulation than TMZ. (C-D) GSCs treated TMZ did not show an increased proportion of the G2/M population. only combined TMZ and EMAP-II induced a higher G2/M accumulation. The values present means ± SD (n = 4, each). *p < 0.05

Figure 4. Effect on PI3K/AKT/mTOR pathway. U87MG and GSCs were treated with either TMZ or EMAP-II and combination of TMZ with EMAP-II for 72 h. (A-D) Western Blot showed relative expressions of PI3K, p-PI3K, AKT, p-AKT, mTOR and p-mTOR, combination of TMZ with EMAP-II enhanced inhibition of p-mTOR/mTOR on U87MG; (E-H) Western Blot showed relative expressions of PI3K, p-PI3K, AKT, p-AKT, mTOR and p-mTOR, combination of TMZ with EMAP-II enhanced inhibition of p-mTOR/mTOR on GSCs. The values present means ± SD (n = 4, each). *p < 0.05, **p < 0.01, or ***p < 0.001.
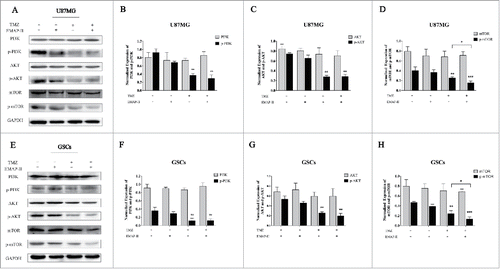
Figure 4. Effect on PI3K/AKT/mTOR pathway. U87MG and GSCs were treated with either TMZ or EMAP-II and combination of TMZ with EMAP-II for 72 h. (A-D) Western Blot showed relative expressions of PI3K, p-PI3K, AKT, p-AKT, mTOR and p-mTOR, combination of TMZ with EMAP-II enhanced inhibition of p-mTOR/mTOR on U87MG; (E-H) Western Blot showed relative expressions of PI3K, p-PI3K, AKT, p-AKT, mTOR and p-mTOR, combination of TMZ with EMAP-II enhanced inhibition of p-mTOR/mTOR on GSCs. The values present means ± SD (n = 4, each). *p < 0.05, **p < 0.01, or ***p < 0.001.

Reprints and Corporate Permissions

Please note: Selecting permissions does not provide access to the full text of the article, please see our help page How do I view content?

To request a reprint or corporate permissions for this article, please click on the relevant link below:

Academic Permissions

Please note: Selecting permissions does not provide access to the full text of the article, please see our help page How do I view content?

Obtain permissions instantly via Rightslink by clicking on the button below:

If you are unable to obtain permissions via Rightslink, please complete and submit this Permissions form. For more information, please visit our Permissions help page.