920
Views
11
CrossRef citations to date
0
Altmetric
Report

Cytidine deaminase deficiency impairs sister chromatid disjunction by decreasing PARP-1 activity

ORCID Icon, , , &
Pages 1128-1135 | Received 13 Jan 2017, Accepted 03 Apr 2017, Published online: 05 May 2017

Figures & data

Table 1. Characterisitics of cell lines.

Figure 1. CDA deficiency leads to an increase in the frequency of Rad21-depleted prometaphase cells with incomplete sister chromatid disjunction. (A) Percentage of BS prometaphase cells expressing BLM and/or CDA, transfected with siRNA specific for Rad21 and sorted on the basis of their phenotype: X-shapes, incomplete disjunction or complete disjunction (n = 3, > 275 prometaphase cells analyzed). (B) Representative immunoblot of BS-Ctrl(BLM), BS-BLM, BS-Ctrl(CDA) and BS-CDA cells transfected with the indicated siRNA. (C) Percentage of HeLa prometaphase cells with and without CDA expression, transfected with siRNA specific for Rad21 and sorted on the basis of their phenotype: X-shapes, incomplete disjunction or complete disjunction (n = 3, > 285 prometaphase cells analyzed). (D) Representative immunoblot of HeLa-Ctrl(CDA) and HeLa-shCDA cells transfected with the indicated siRNA. (E) Percentage of HeLa Rad21-depleted prometaphase cells with and without CDA expression, left untreated or treated with 1 mM dC for 16 hours and sorted on the basis of their phenotype: X-shapes, incomplete disjunction or complete disjunction (n = 3, > 150 prometaphase cells analyzed). (F) Representative immunoblot of HeLa-Ctrl(CDA) and HeLa-shCDA cells left untreated or treated with 1 mM dC for 16 hours and transfected with the indicated siRNA. Error bars represent the mean ± SD. Statistical significance was assessed with Student's t-test.
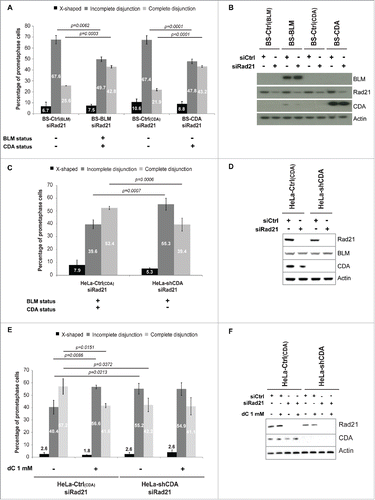
Figure 1. CDA deficiency leads to an increase in the frequency of Rad21-depleted prometaphase cells with incomplete sister chromatid disjunction. (A) Percentage of BS prometaphase cells expressing BLM and/or CDA, transfected with siRNA specific for Rad21 and sorted on the basis of their phenotype: X-shapes, incomplete disjunction or complete disjunction (n = 3, > 275 prometaphase cells analyzed). (B) Representative immunoblot of BS-Ctrl(BLM), BS-BLM, BS-Ctrl(CDA) and BS-CDA cells transfected with the indicated siRNA. (C) Percentage of HeLa prometaphase cells with and without CDA expression, transfected with siRNA specific for Rad21 and sorted on the basis of their phenotype: X-shapes, incomplete disjunction or complete disjunction (n = 3, > 285 prometaphase cells analyzed). (D) Representative immunoblot of HeLa-Ctrl(CDA) and HeLa-shCDA cells transfected with the indicated siRNA. (E) Percentage of HeLa Rad21-depleted prometaphase cells with and without CDA expression, left untreated or treated with 1 mM dC for 16 hours and sorted on the basis of their phenotype: X-shapes, incomplete disjunction or complete disjunction (n = 3, > 150 prometaphase cells analyzed). (F) Representative immunoblot of HeLa-Ctrl(CDA) and HeLa-shCDA cells left untreated or treated with 1 mM dC for 16 hours and transfected with the indicated siRNA. Error bars represent the mean ± SD. Statistical significance was assessed with Student's t-test.

Figure 2. CDA deficiency is associated with structural changes to the centromere. (A) Representative deconvoluted z-projection immunofluorescence images of prometaphase HeLa cells with and without CDA expression. DNA was visualized by staining with DAPI (in blue). The centromeres of chromosome 8 were stained with a Cen8 probe (in green). Scale bar: 5 µm. (B) Relative 3D volume of FISH signals in HeLa-Ctrl(CDA) (black bars) and HeLa-shCDA (gray bars) cell lines (n = 3, > 90 prometaphase cells analyzed). (C) Relative 3D volume of FISH signals in HeLa-Ctrl(CDA) (black bars) and HeLa-shCDA (gray bars) cells left untreated or treated with 1 mM dC for 16 hours (n = 3, > 285 prometaphase cells analyzed). Error bars represent the mean ± SD. Statistical significance was evaluated with Student's t-test; ns: not significant.
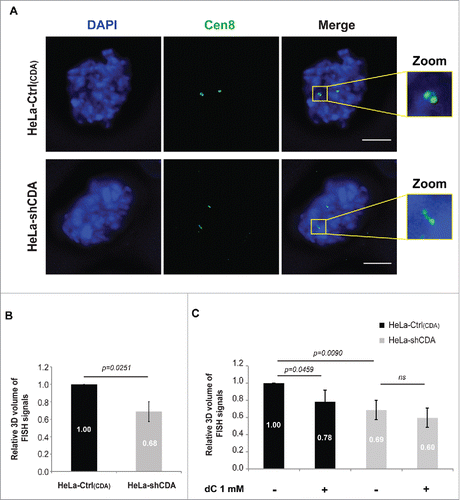
Figure 2. CDA deficiency is associated with structural changes to the centromere. (A) Representative deconvoluted z-projection immunofluorescence images of prometaphase HeLa cells with and without CDA expression. DNA was visualized by staining with DAPI (in blue). The centromeres of chromosome 8 were stained with a Cen8 probe (in green). Scale bar: 5 µm. (B) Relative 3D volume of FISH signals in HeLa-Ctrl(CDA) (black bars) and HeLa-shCDA (gray bars) cell lines (n = 3, > 90 prometaphase cells analyzed). (C) Relative 3D volume of FISH signals in HeLa-Ctrl(CDA) (black bars) and HeLa-shCDA (gray bars) cells left untreated or treated with 1 mM dC for 16 hours (n = 3, > 285 prometaphase cells analyzed). Error bars represent the mean ± SD. Statistical significance was evaluated with Student's t-test; ns: not significant.

Figure 3. Optimal PARP-1 activity is required to prevent incomplete sister chromatid disjunction and abnormal centromeric DNA structure. (A) Percentage of HeLa Rad21-depleted prometaphase cells with and without CDA expression, left untreated or treated with 2 pM CPT for 16 hours and sorted on the basis of their phenotype: X-shapes, incomplete disjunction or complete disjunction (n = 3, > 230 prometaphase cells analyzed). (B) Representative immunoblot of HeLa-Ctrl(CDA) and HeLa-shCDA cells left untreated or treated with 2 pM CPT for 16 hours and transfected with the indicated siRNA. (C) Relative 3D volume of FISH signals in HeLa-Ctrl(CDA) (black bars) and HeLa-shCDA (gray bars) cells left untreated or treated with 2 pM CPT for 16 hours (n = 3, > 290 prometaphase cells analyzed). (D) Percentage of HeLa Rad21-depleted prometaphase cells with and without CDA expression, left untreated or treated with 1 µM olaparib for 16 hours and sorted on the basis of their phenotype: X-shapes, incomplete disjunction or complete disjunction (n = 3, > 110 prometaphase cells analyzed). (E) Representative immunoblot of HeLa-Ctrl(CDA) and HeLa-shCDA cells left untreated or treated with 1 µM olaparib for 16 hours and transfected with the indicated siRNA. (F) Percentage of HeLa Rad21-depleted prometaphase cells with and without PARP-1 expression, sorted on the basis of phenotype: X-shapes, incomplete disjunction or complete disjunction (n = 3, > 230 prometaphase cells analyzed). (G) Representative immunoblot of HeLa-Ctrl(PARP-1) and HeLa-shPARP-1 cell lines transfected with the indicated siRNAs. Error bars represent the mean ± SD. Statistical significance was assessed with Student's t-test.
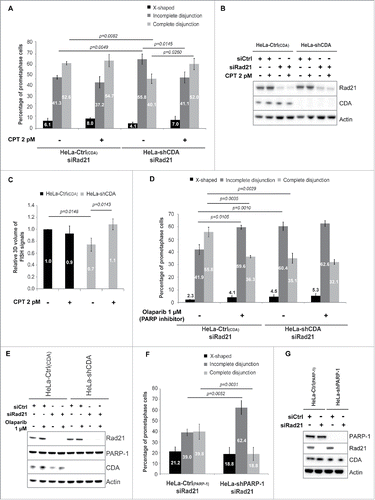
Figure 3. Optimal PARP-1 activity is required to prevent incomplete sister chromatid disjunction and abnormal centromeric DNA structure. (A) Percentage of HeLa Rad21-depleted prometaphase cells with and without CDA expression, left untreated or treated with 2 pM CPT for 16 hours and sorted on the basis of their phenotype: X-shapes, incomplete disjunction or complete disjunction (n = 3, > 230 prometaphase cells analyzed). (B) Representative immunoblot of HeLa-Ctrl(CDA) and HeLa-shCDA cells left untreated or treated with 2 pM CPT for 16 hours and transfected with the indicated siRNA. (C) Relative 3D volume of FISH signals in HeLa-Ctrl(CDA) (black bars) and HeLa-shCDA (gray bars) cells left untreated or treated with 2 pM CPT for 16 hours (n = 3, > 290 prometaphase cells analyzed). (D) Percentage of HeLa Rad21-depleted prometaphase cells with and without CDA expression, left untreated or treated with 1 µM olaparib for 16 hours and sorted on the basis of their phenotype: X-shapes, incomplete disjunction or complete disjunction (n = 3, > 110 prometaphase cells analyzed). (E) Representative immunoblot of HeLa-Ctrl(CDA) and HeLa-shCDA cells left untreated or treated with 1 µM olaparib for 16 hours and transfected with the indicated siRNA. (F) Percentage of HeLa Rad21-depleted prometaphase cells with and without PARP-1 expression, sorted on the basis of phenotype: X-shapes, incomplete disjunction or complete disjunction (n = 3, > 230 prometaphase cells analyzed). (G) Representative immunoblot of HeLa-Ctrl(PARP-1) and HeLa-shPARP-1 cell lines transfected with the indicated siRNAs. Error bars represent the mean ± SD. Statistical significance was assessed with Student's t-test.

Figure 4. Balanced pyrimidine pool is required to promote optimal sister chromatid disjunction. Excess cellular dCTP, due to CDA deficiency, compromises basal PARP-1 activity, leading to the accumulation of unreplicated DNA sequences during mitosis, as revealed by the decrease in centromeric volume. As a consequence, sister chromatids remain physically linked in cohesin-depleted cells, revealing a defect in chromosome segregation.
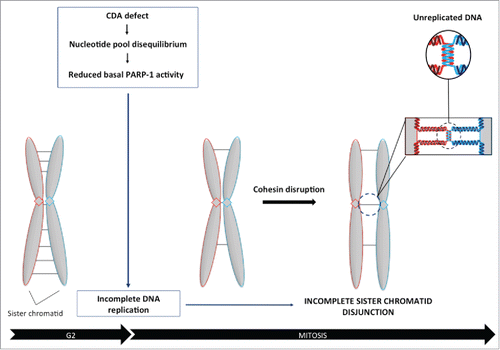
Figure 4. Balanced pyrimidine pool is required to promote optimal sister chromatid disjunction. Excess cellular dCTP, due to CDA deficiency, compromises basal PARP-1 activity, leading to the accumulation of unreplicated DNA sequences during mitosis, as revealed by the decrease in centromeric volume. As a consequence, sister chromatids remain physically linked in cohesin-depleted cells, revealing a defect in chromosome segregation.
Supplemental material

1317413_Supplemental_Material.docx

Download MS Word (28.3 MB)

Reprints and Corporate Permissions

Please note: Selecting permissions does not provide access to the full text of the article, please see our help page How do I view content?

To request a reprint or corporate permissions for this article, please click on the relevant link below:

Academic Permissions

Please note: Selecting permissions does not provide access to the full text of the article, please see our help page How do I view content?

Obtain permissions instantly via Rightslink by clicking on the button below:

If you are unable to obtain permissions via Rightslink, please complete and submit this Permissions form. For more information, please visit our Permissions help page.