Figures & data
Figure 1. Pulsed Low Dose Rate Radiotherapy (PLDR) is associated with reduced levels of bone marrow and intestinal atrophy at equivalent doses of Conventional Radiotherapy (CRT). H/E staining shows cellular atrophy in the bone marrow (BM) (A) and the cecum (B) following treatment with CRT and PLDR. Morphometric quantitation using the NIH Image J software of atrophic areas in the BM, pancreas and intestine is shown (C). The arithmetic mean of a minimum of 5 analyzed tissue areas from 1–2 mice is shown. Error bars represent the standard error. BM, bone marrow.
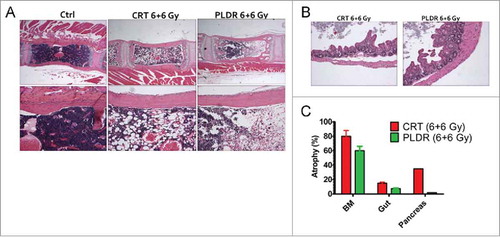
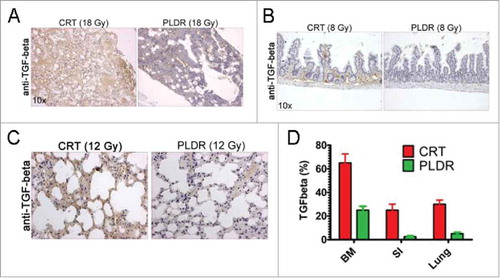
Figure 2. TGF-β is expressed at higher levels in tissues in vivo following CRT treatment. Tissues were subjected to immunohistochemical analysis for TGF-β and increased expression of the cytokine was observed in the bone marrow (A) at doses of 18 Gy, the intestine at doses of 8 Gy (B) and in lung at doses of 12 Gy (C). The areas in the tissues showing increased expression of TGF-β were quantitated using the NIH Image J software (E). The arithmetic mean of a minimum of 5 analyzed tissue areas from 1–2 mice is shown. Error bars represent the standard error. BM, bone marrow; SI, small intestine.