Figures & data
Figure 1. Recombinant Hsp60 Protein Purity and Size Determination. a) 15% SDS-Gel depicting the purity and monomeric sizes of recombinant Hsp60 and Hsp10 proteins. Hsp10 runs anomalously due to the presence of a His6 Tag. b) 5% Native-Gel showing the purity and oligomeric size of the APO-Hsp60 protein and β-galactosidase protein (Sigma). c) Dynamic Light Scattering (DLS) of APO-Hsp60 (blue curve), 22.11 nm (PDI = 0.209); β-galactosidase (red curve), 18.76 nm (PDI = 0.346).
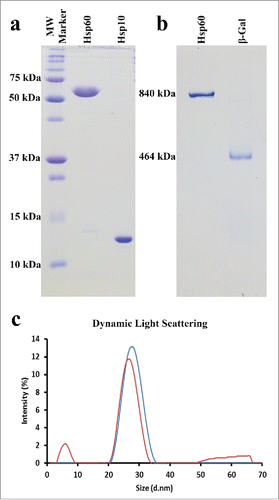
Figure 2. Electron Micrographs of Hsp60 and GroEL. a) Negative stain electron micrograph showing APO-Hsp60 side views (blue box), Hsp60 top views (green box), and Hsp10 heptamers (red box). The particle contrast was inverted using EMAN2 so that the particles appear white on a dark background. b) Cryo-EM micrographs showing GroEL side views (blue box), and GroEL top views (green box). Figure was adapted and modified from Elad et al. (Citation2007).
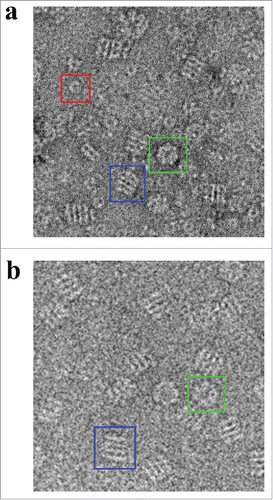
Figure 3. ENZCHEK ATPase Assay of Recombinant Human Mitochondrial Hsp60 and Hsp10. Purified Hsp60 and Hsp10 in the presence of α-lactalbumin at 40 μM and 60 μM concentrations, and in the absence of α-lactalbumin. The rise in absorbance for Hsp60/10 without denatured α-lactalbumin can be attributed to self-hydrolysis of ATP over the time interval of the reaction.
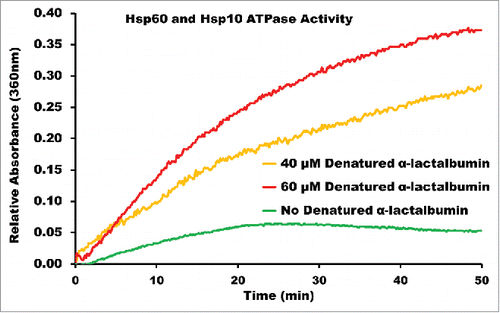
Figure 4. Generation of the Initial Model of the Human Mitochondrial APO-Hsp60. a) Electron micrograph of APO-Hsp60 in the absence of Hsp10. Blue boxes encase Hsp60 side-views and green boxes encase top-views. b) APO-Hsp60 particles picked from the data set represented by the micrographs in “a.” c) Reference free initial class averages of the Hsp60 particles picked from the micrographs referenced in “b.” d) Hsp60 Initial model generated from the reference free class averages.
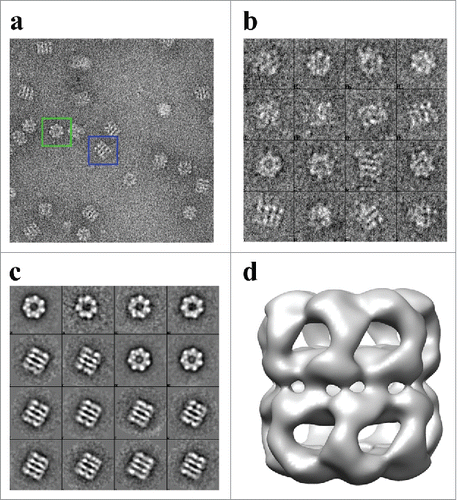
Figure 5. Iso-surface representation of the Human Mitochondrial APO-Hsp60 Reconstruction. a) Top view depicting the 7-fold arrangement of the Hsp60 subunits. b) The equatorial domains of the Hsp60 tetradecamer. c) Side-view orthogonal to the 7-fold axis showing the two heptameric rings that make-up the Hsp60 tetradecamer. d) Slab view displaying the interior of the tetradecamer and the inter-ring space. e) Fourier Shell Correlation (FSC) curve used to determine the resolution of the Hsp60 reconstruction at the 0.5 cutoff = 15 Å resolution, and the 0.143 cutoff = 14 Å resolution. The FSC curve shows that the data used for the reconstruction is self-consistent.
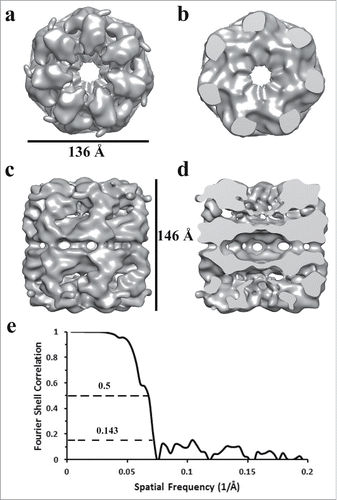
Figure 6. Comparison of Two Iso-Surface Thresholds of the APO-Hsp60 EM-Reconstruction. a) Side view of the Hsp60 reconstruction at a high iso-surface threshold. At high a threshold tubular densities can be observed but densities corresponding to intra- and inter-ring contacts appear broken. b) The Hsp60 reconstruction visualized at a lower iso-surface threshold. At a lower threshold, contacts between subunits are better resolved.
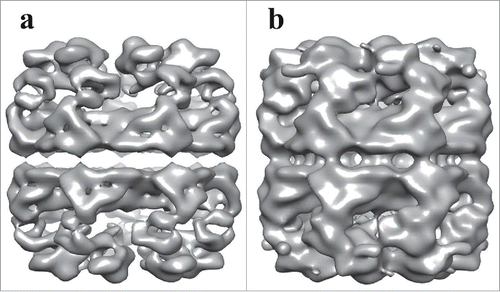
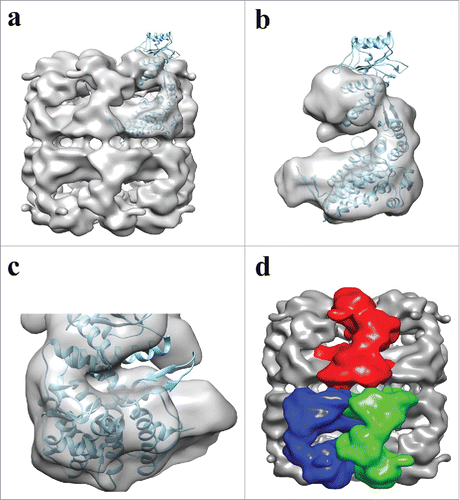
Figure 7. Fitting of ATP-Hsp60/10 crystal structure into APO-Hsp60 EM-Reconstruction. a) Side view depicting the fitting between the crystal subunit (4PJ1) and the full Hsp60 EM-reconstruction. b) A single subunit showing the crystal subunit docked into the EM-Hsp60 subunit. The apical domain of the X-ray structure is in the ATP conformation and is therefore outside of the APO conformation density of the reconstruction. c) The subunit seen in “b” was rotated 180° and shows differences between the two maps. d) Side view of the APO-Hsp60 reconstruction showing the inter-ring subunit arrangement. The crystal subunit was adapted and modified from the 4PJ1 PDB structure.