Figures & data
Figure 1. B56γ- MEFs arrest less efficiently in G2/(M)following nocodazole treatment. (A-D) DNA content was measured by flow cytometry using propidium iodide in untreated wild type (+/+) and B56γ- (−/−) MEFs. No difference in DNA content was seen between cell populations in untreated cells (A, B). DNA content analysis following 18 hour incubation in 200 ng/ml nocodazole (NOC) shows less G2/M B56γ- MEFs compared with wild type cells (C, D). (E) Percentage of nocodazole treated cells with G2/M DNA content, B56γ- 45%, wild type 68%. The mean and SEM were calculated from 10 experiments.
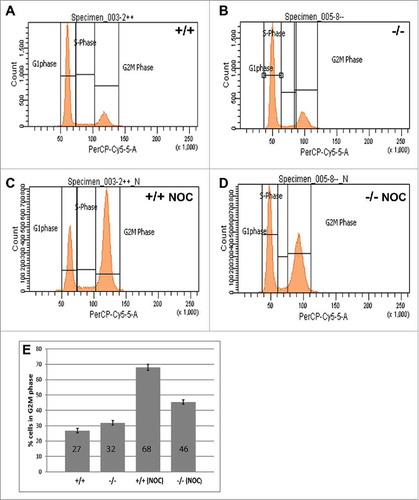
Figure 2. Nocodazole treated B56γ- MEFs have fewer (M)phase cells compared with wild type. (A-D) Immunostaining showing Histone H3 pSER10 (pH3, green, arrows), DAPI (Blue) labeling in conjunction with α-Tubulin (red) in wild type (+/+) and B56γ- (−/−) MEFs. Lower number of cells in M phase in B56γ- MEFs (C, D) were observed as compared with wild type (A, B), following 18 hours of nocodazole treatment. Images are representative of 3 independent experiments from each genotype group. All the images were captured at 60X magnification. (E) Percent pH3+ cells and SEM represent data from 300 MEFs of each genotype. (F-I) Caspase-3 labeling (green) and DAPI (blue), showing apoptotic cells in wild type (+/+) and B56γ- (−/−) MEFs. Higher numbers of apoptotic cells were observed in wild type MEFs (F, G) as compared with the B56γ- MEFs (H, I) following 18 hours of nocodazole treatment (NOC). Images are representative of 3 independent experiments from each genotype group. (J) Percent apoptotic cells and SEM represent data from 300 MEFs of each genotype.
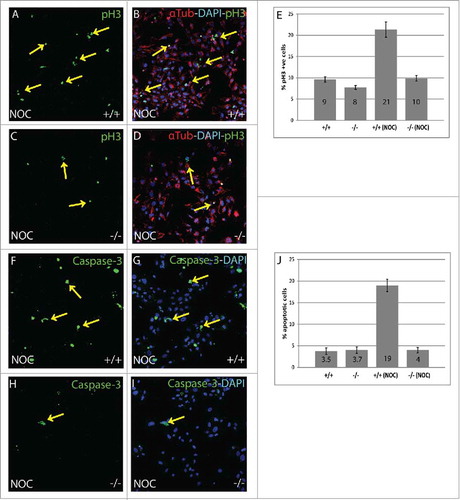
Figure 3. Chromosomal abnormalities are detected in B56γ- MEFs. (A-D) Immunohistochemical analysis with antibodies specific for Histone H3 pSER10 (pH3, green), DAPI (blue) and α-Tubulin (red), showing lagging or misaligned chromosomes (shown with yellow arrows) in the B56γ- MEFs treated with nocodazole. Representative images were obtained using a 100X objective. Chromosomal lagging was recorded at approximately 2% per 1000 total cells in nocodazole treated B56γ- MEFs. Data are representative of 3 independent experiments, using 3 B56γ- and B56γ+ MEF samples. E) Time lapse microscopy live images captured at the indicated time points from NEBD of nocodazole treated B56γ- MEFs. Of the 21 B56γ- MEFs, 13 displayed abnormal chromosomal segregation (shown with yellow arrows).
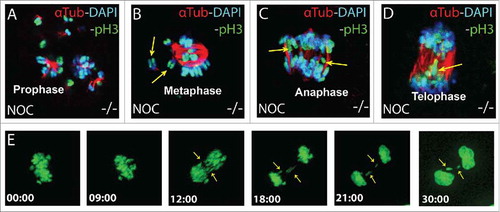
Figure 4. Endogenous expression of B56 subunits in MEFs. A) RT-PCR was used to detect native B56α, B56β, B56γ, B56δ and B56ϵ mRNA in wild type MEFs, -RT = no transcriptase. (B - F) Immunohistochemical analysis using antibodies to B56α, B56β, B56γ, B56ϵ (green) and B56δ (red) with DAPI (blue) in wild type MEFs. Representative immunofluorescence images from MEFs at E14.5. Representative images from 3 independent experiments were obtained using a 60X objective.
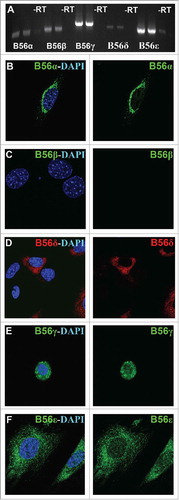
Figure 5. B56γ and B56ϵ localization during mitosis. Immunostaining of MEFs was done using antibodies against B56γ (green, A - D) or B56ϵ (green, E- H) along with α Tubulin (red) and DAPI (blue) in prophase, metaphase, anaphase and telophase respectively. Representative immunofluorescence images from MEFs at E14.5. Representative images from 3 independent experiments were obtained using a 60X objective.
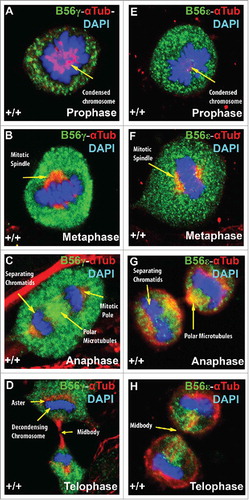
Figure 6. B56γ is present near or co-localizes with BubR1 throughout mitosis. (A, B) Merge images show B56γ (green) and BubR1 (red) in close proximity during prophase in condensed chromatin (yellow arrow). At prometaphase, co-localization was observed at the chromosomal circle (C, D). B56γ and BubR1 were present at the metaphase plate (E, F) and in the separating daughter chromosomes in anaphase (G, H). BubR1 expression diminishes by telophase (I, J). Representative immunofluorescence images from 3 independent experiments were obtained using a 60X objective.
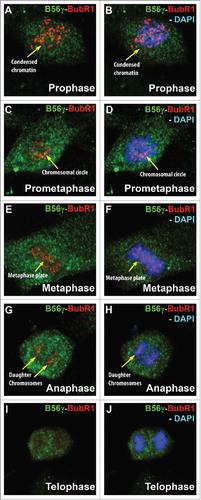
Figure 7. Nocodazole treatment of B56γ- MEFs depletes BubR1 and Cyclin B. Western blot analyses were performed on protein extracts from synchronized wild type (+/+) and B56γ- (−/−) MEFs. Less BubR1 is present in untreated B56γ- MEFs than in wild type MEFs. BubR1 and Cyclin B1 were not detected in the nocodazole treated B56γ- MEFs. No change was observed in the expression of the catalytic subunit of PP2A. Data are representative of 3 experiments, using 3 B56γ- and B56γ+ MEF extracts.
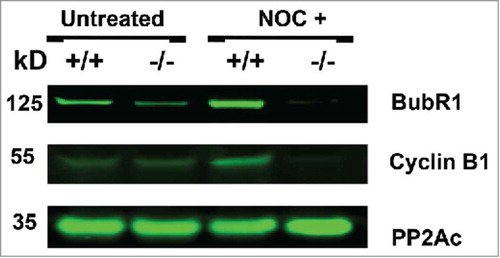
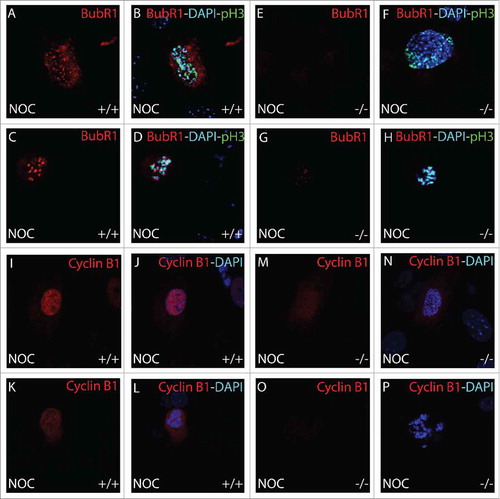
Figure 8. Immunohistochemical analysis of BubR1 and Cyclin B1 during mitosis. BubR1 (red, A-H) or Cyclin B1 (red, I-P), Histone H3 pSer10 (pH3, green) and DAPI (blue) were detected by immunohistochemistry. Following 18 hour nocodazole (NOC), BubR1 expression was found to be absent throughout prophase in B56γ- (−/−) MEFs (E-H) but present in the wild type (+/+) MEFs (A-D). Less Cyclin B1 was observed in the nocodazole treated B56γ- MEFs (M, N) at early prophase compared with wild type MEFs (I, J). By late prophase, Cyclin B1 was not detectable (O, P) but present in the wild type MEFs (K, L). All images were captured at 60X magnification. Data are representative of 3 independent experiments from approximately 50 different cells from each genotype.