Figures & data
Figure 1. Cellular localization of HDAC6 in mouse oocytes. Oocytes at GV, Pre-Metaphase I, and Metaphase II stages were immunolabeled with HDAC6 antibody (green) and counterstained with propidium iodide for DNA (red), respectively. Representative images were acquired under the confocal microscope. HDAC6 signals are indicated by arrowheads. Scale bar, 25 μm.
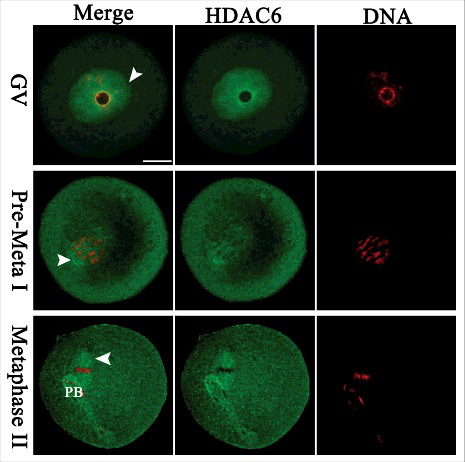
Figure 2. Effects of HDAC6 inhibition on oocyte maturation. Different concentrations of TubA were used to examine the effects of HDAC6 inhibition on mouse oocyte maturation. Fully grown oocytes treated with TubA were cultured for 14 hours to evaluate the rate of GVBD and Pb1 extrusion. (A) Phase-contrast images of control and TubA-treated (1.0 μg/ml) oocytes. Blue arrows indicate the oocytes that fail to extrude polar bodies; Red arrowheads indicate the oocytes with symmetric division; Asterisks indicate the oocytes with normal division. Scale bar, 100 μm. (B, C) Quantitative analysis of GVBD rate and Pb1 extrusion rate in control (n = 118) and TubA-treated (n = 120) oocytes. The graph shows the mean ± SD of the results obtained in 3 independent experiments. *P<0.05; **P < 0.01; ***P < 0.001 vs. control.
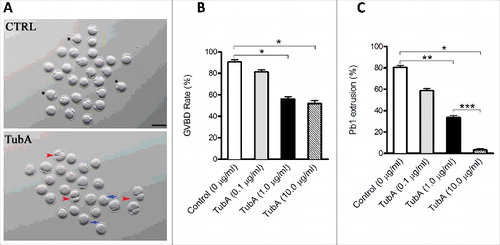
Figure 3. Effects of HDAC6 inhibition on spindle assembly and chromosome organization in oocytes. (A) Control and TubA-treated oocytes were immunostained with anti-α-tubulin antibody to visualize the spindle (green) and counterstained with PtdIns to visualize chromosomes (red). Representative confocal sections are shown. Control metaphase oocytes (a) present a typical barrel-shape spindle and well-organized chromosomes on the metaphase plate; (b, c) TubA-treated oocytes frequently show abnormal spindles (arrow) and chromosome misalignment (arrowheads). Scale bar, 25 μm. (B) Quantification of control (n = 120) and TubA-treated (n = 126) oocytes with spindle/chromosome defects. Data are expressed as mean percentage ± SD from 3 independent experiments. *p< 0.05 vs. controls.
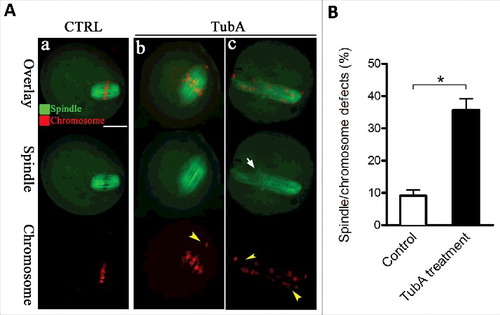
Figure 4. Effects of HDAC6 inhibition on kinetochore-microtubule attachments. (A) Representative images of K-MT attachments in control and TubA-treated oocytes. Oocytes at MI stage were immunolabeled with anti-tubulin antibody to visualize spindles (green), with CREST to detect kinetochores (purple), and counterstained with Hoechst 33342 to show chromosomes (blue). Scale bar, 10 μm. Representative confocal sections showed the amphitelic attachment in control oocytes (white arrows), and lost/merotelic attachments (yellow arrowheads) in TubA-treated oocytes. (B) Quantitative analysis of the proportion of defective K-MT attachments in control (n = 15) and TubA-treated (n = 16) oocytes. Data were presented as mean percentage ± SD from 3 independent experiments. *p< 0.05 vs. controls.
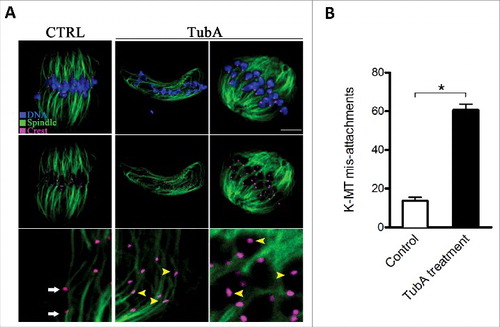
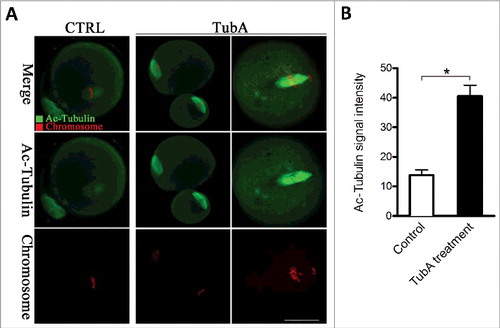
Figure 5. Effects of HDAC6 inhibition on the acetylation state of tubulin in mouse oocytes. (A) Representative confocal sections showing the acetylated tubulin (green) and chromosomes (red) in control and TubA-treated oocytes. Scale bar, 30 μm. (B) Quantitative analysis of the fluorescence intensity of acetylated α-tubulin in control (n = 36) and TubA-treated (n = 38) oocytes. Data were presented as mean percentage ± SD from 3 independent experiments. *p < 0.05 vs. controls.